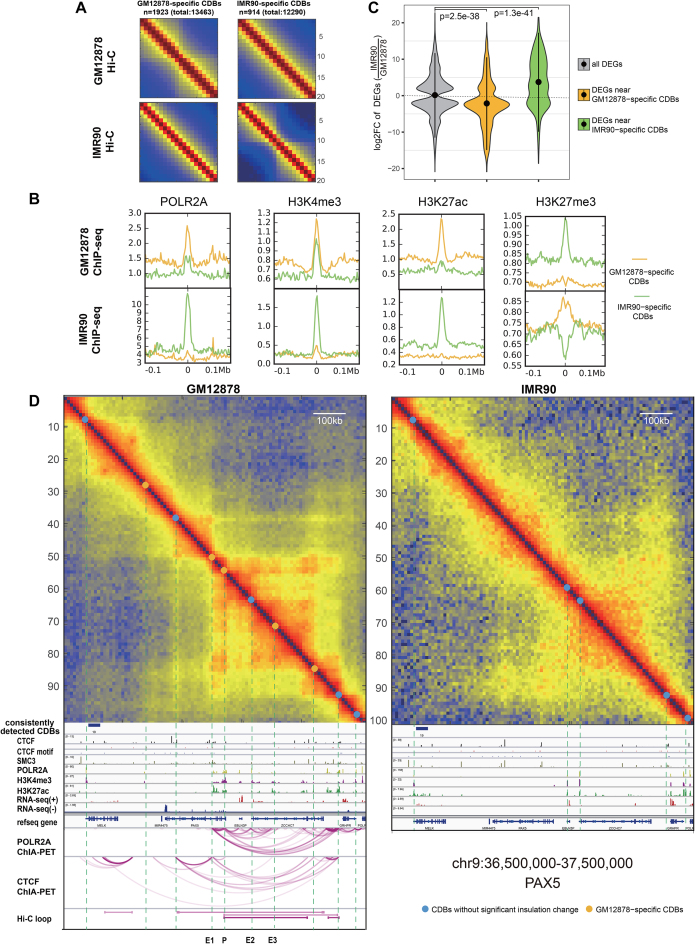
Figure 5.
Comparison of GM12878 and IMR90 from the CDB view. (A) Aggregation of Hi-C maps centered on the differential CDBs. Hi-C maps show a gain of insulation at the cell-type-specific CDBs. (B) Cell-type-specific CDBs enriched in cell-type-specific active regulatory signals. (C) The fold change distributions of the differential expressed genes near differential CDBs. P value is calculated using Wilcoxon rank-sum test. (D) A differential region (chr9:36.50–37.50 Mb) between GM12878 and IMR90 detected by HiCDB. This region possesses a B cell important regulator, PAX5, which is not expressed in IMR90. E1-E3 marks three potential enhancers of PAX5 detected by HiCDB other than HiCCUPs. The IMR90 POLR2A- and CTCF-mediated loops are not shown because the ChIA-PET data are not currently available, while the Hi-C loops are not shown because no Hi-C loops were detected on the IMR90 Hi-C map in this region.

