Figure 5.
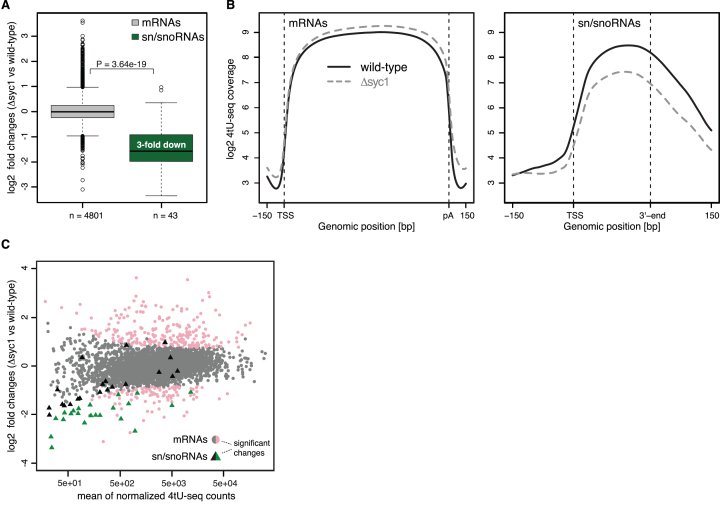
SYC1 deletion leads to down-regulation of sn/snoRNA transcription. (A) Distribution of log2 fold changes of normalized 4tU-RNA-seq read counts for Δsyc1 versus wild-type cells for selected mRNAs (grey, n = 4801) and sn/snoRNAs (green, n = 43) (see Materials and Methods). The P-value was derived by two-sided Mann–Whitney U test. Box limits are the first and third quartiles, the band inside the box is the median. The ends of the whiskers extend the box by 1.5 times the interquartile range. (B) Transcript-averaged coverage of newly synthesized RNA measured by 4tU-Seq in wild-type (solid line) and Δsyc1 (dashed line) yeast over selected mRNAs (left) and sn/snoRNAs (right) (as in A). Before averaging, normalized transcript profiles were aligned at their TSS and length-scaled such that their pA sites/3′-ends coincided. (C) MA-plot showing log2 fold change for each transcript between Δsyc1 and wild-type yeast, versus the normalized mean read count across replicates and conditions. Transcripts with a fold change >1.5 and adjusted P-value below 0.1 (as calculated by DESeq2, Materials and Methods) are shown in color. mRNAs and sn/snoRNAs are shown as grey/pink circles and black/green triangles, respectively.

