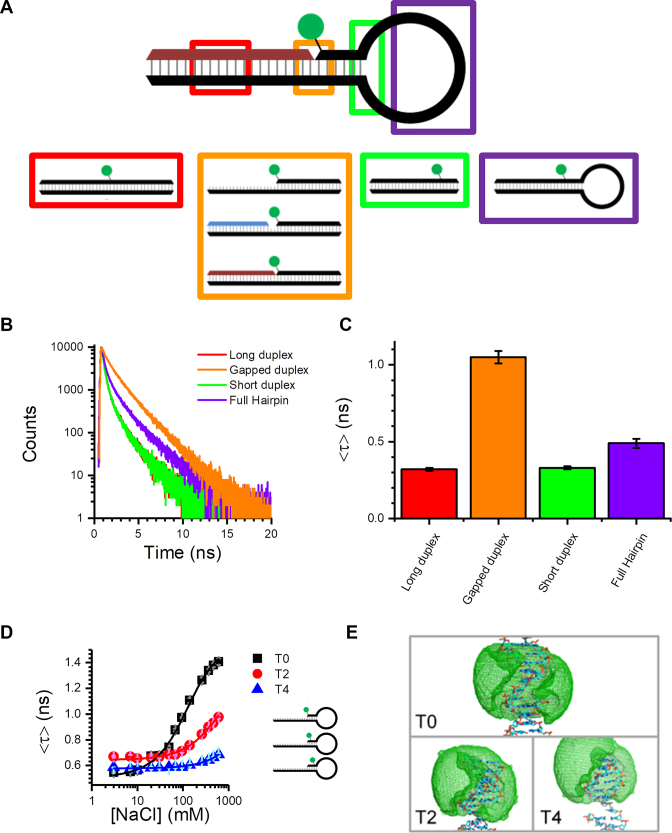
Figure 2.
Stacking-induced fluorescence increase of Cy3. (A) Immobile DNA structures designed to probe the possible interactions between the Cy3 dye and the DNA hairpin (see Supplementary Figure S2 for additional structures). (B and C) Time-resolved decays (B) and amplitude-weighted average lifetimes (C) for Cy3 attached to representative duplex structures (the buffer contained 50 mM NaCl). (D) Amplitude-weighted average lifetime as a function of NaCl concentration for hairpins with different dye positions. Moving the dye away from the ssDNA–dsDNA junction reduces the enhancement. (E) AV calculations illustrate that the dye can explore up to four bases along duplex DNA (see Supplementary Figure S7 for expanded versions of these). Error bars in (C) and (D) represent the standard deviation (N = 3).

