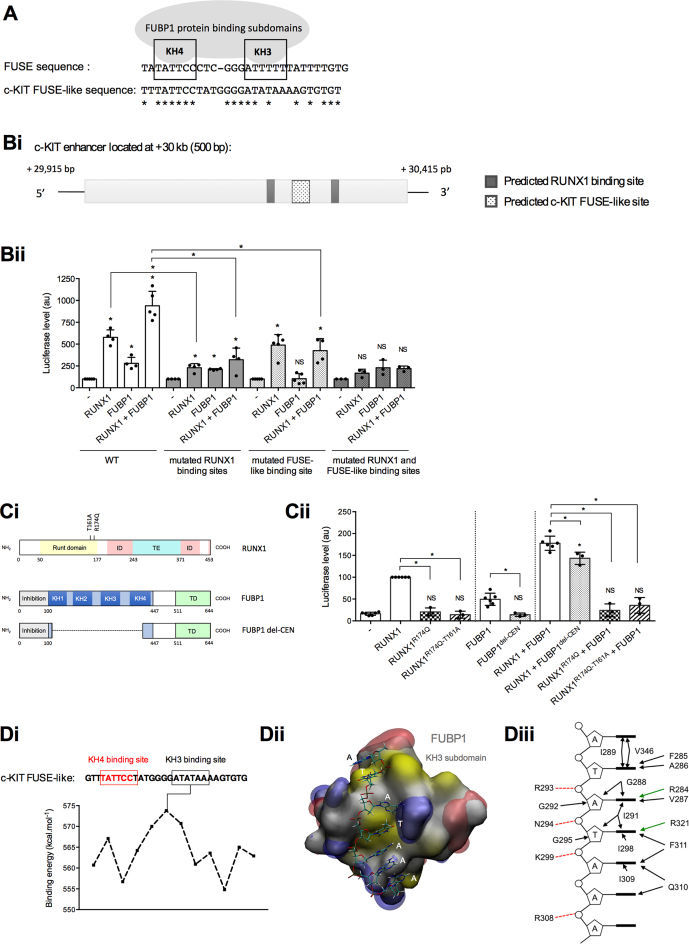
Figure 5.
Identification of RUNX1 and FUBP1 DNA binding motifs within the +30 kb enhancer of c-KIT. (A) Schematic representation of two functional subdomains (KH3 and KH4) of FUBP1 required for its binding to the FUSE sequence located –1.5 kb upstream the c-MYC P1 promoter (20,59). Potential c-KIT FUSE-like sequence within the +30 kb c-KIT intronic enhancer (identified by in silico analysis) is provided. Nucleic acid homology is represented by asterisks (*). The c-KIT FUSE-like sequence showed 48.2% homology compared to the FUSE sequence according to CLUSTAL 2.1 Multiple Sequence Alignments software (83). (Bi) Scheme of the human c-KIT enhancer. Predicted RUNX1 binding sites with more than 80% sequence conservation from Jaspar RUNX1 matrix (MA0002.1) have been selected with Jaspar software (61). (Bii) Luciferase assays with a vector full-length or mutated variants of the +30 kb c-KIT enhancer downstream a minimal promoter and a luciferase ORF, in presence of RUNX1 and FUBP1 expressing vectors were performed in HEK293shFUBP1 cells. In the mutated variants, RUNX1 predicted binding sites 5′-GGTGTTGTG-3′ and 5′-ATTGTGGTTA-3′ were site-directed mutated or the predicted FUBP1 FUSE-like binding sequence was deleted. Luciferase levels (firefly luciferase/Renilla luciferase) are represented using a bar chart-scatter dot plot indicating the means with S.D. of at least four independent experiments. Luciferase activities are normalized to the control (–). NS: non-significant, *P < 0.05 in Mann–Whitney tests. (Ci) Scheme of RUNX1 and FUBP1 proteins with indication of the position of mutations for RUNX1, and truncated FUBP1. ID: inhibition domain, TE/TD: transactivation domain. (Cii) Luciferase assays with a vector containing the +30 kb c-KIT enhancer downstream a minimal promoter and a luciferase ORF, in presence of RUNX1 mutants and truncated FUBP1 expressing vectors were performed in HEK293shFUBP1 cells. Luciferase levels are represented as in Bii.(Di) Binding energies (kcal.mol-1) of the KH3 subdomain of FUBP1 protein with the c-KIT FUSE-like sequence. Red framed sequence corresponds to the positioning of KH4 subdomain by analogy to the FUSE sequence retrieved on c-MYC promoter associated to the solution NMR structure of KH4 (PDB ID: 1J4W). Maximum binding energy of KH3 is computed for 5′-ATATAAA-3′. (Dii) Structural model for the most stable complex formed by the KH3 subdomain with the c-KIT +30 kb enhancer sequence. Protein is shown as a molecular surface colored according to hydrophobicity (84) (white for hydrophilic, yellow for hydrophobic), electrostatic potentials are represented as iso-surfaces (–50kTe in red and +50kTe in blue). Tilt observed between second (dT) and third (dA) bases originates from the position of the KH3 first alpha-helix, as it was observed in the experimental structure used as structural template for modeling. (Diii) Schematic representation of the amino-acids of KH3 subdomain of FUBP1 involved in the binding to the FUSE sequence.

