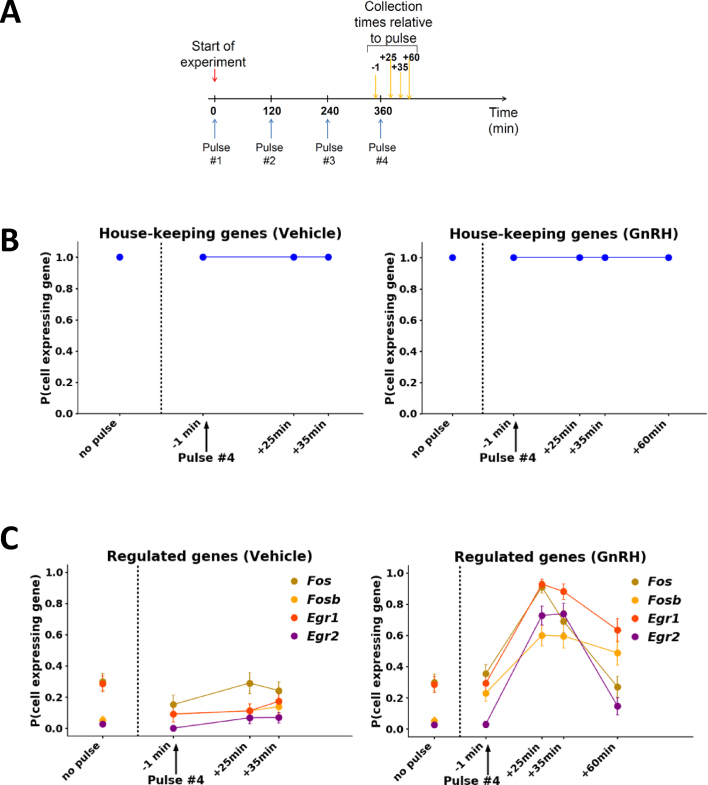
Figure 4.
IEGs show bimodal SC responses to GnRH pulse stimulation. (A) Schematic of the time course experiment design. Cells were exposed to four pulses of GnRH (blue arrows) and collected at short time intervals around the 4th pulse (yellow arrows). (B, C) Graphs showing the probability for a SC to express a house-keeping gene (either Eef1a, H2fz, Rps11, or Rps25; (B)) or a regulated gene (as indicated; (C)) following either vehicle or GnRH treatment. Error bars are based on the binomial standard deviation on the number of gene-expressing cells. In C, Right panel, the +25 min and +35 min data points are statistically different from −1 min.

