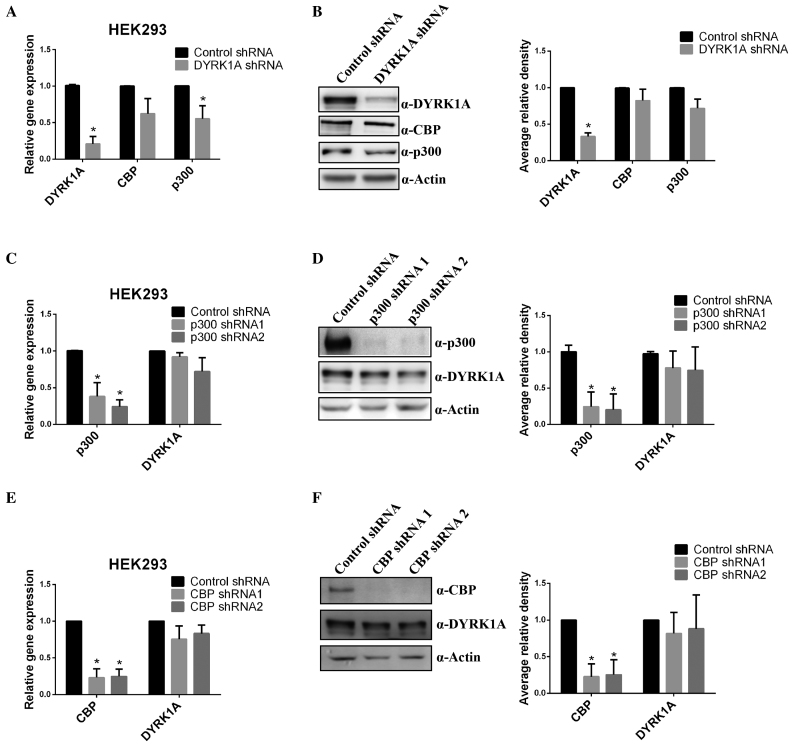
Figure 3.
Reduction in DYRK1A leads to a weak reduction in expression of p300 and CBP. (A) RT-qPCR analysis of CBP and p300 mRNA levels after knockdown of DYRK1A with shRNA in 293 cells. GAPDH mRNA was used to normalize RNA in RT-qPCR samples. Data represent the mean ± SD (n = 3 biological replicates). (B) Western blot analysis of p300, CBP and DYRK1A proteins levels in whole cell extracts, after knockdown of DYRK1A with shRNA in 293 cells (n = 3 biological replicates). Actin was used as loading control in all western samples. Right graph shows quantification of western signal as the mean ±SD (n = 3 biological replicates). Signals were quantitated using Image J software. (C and E) RT-qPCR analysis of DYRK1A mRNA levels after knockdown of CBP or p300 with shRNAs in 293 cells. GAPDH mRNA was used to normalize RNA in RT-qPCR samples. Data represent the mean ± SD (n = 3 biological replicates). (D and F) Western blot analysis of DYRK1A protein levels in whole cell extracts, after knockdown of CBP or p300 with shRNAs in 293 cells. Actin was used as a loading control in all western samples. (n = 3 biological replicates). Graph on the right shows quantitation as in figure B. Student's t test were done to compare samples. P value = * (P < 0.05).

