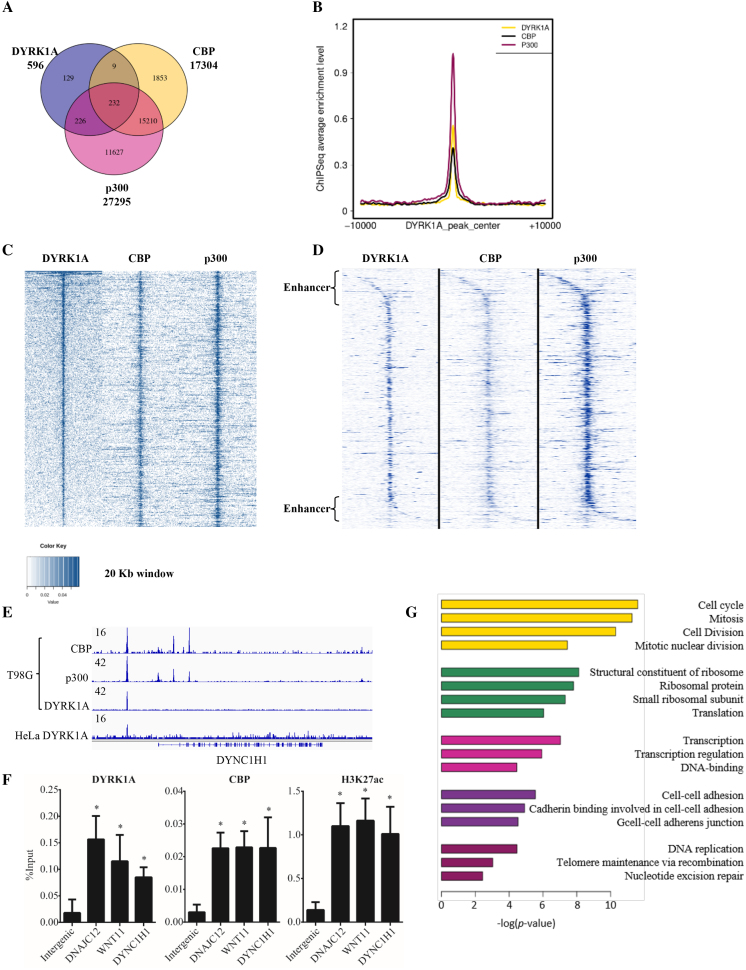
Figure 4.
DYRK1A is associated with enhancer regions in T98G cells. (A) Venn diagram analysis of ChIP-seq data of DYRK1A, p300 and CBP in cycling T98G cells. Raw ChIP-seq data were obtained from GEO (GSE63712 and GSE21026) (12,20). (B) Profiles of CBP (black), p300 (red) centered on DYRK1A (yellow) peak. (C) Analysis of DYRK1A, p300 and CBP ChIP-seq data in cycling T98G cells. Occupancy levels of DYRK1A, p300 and CBP are shown. Profiles are centered on DYRK1A-occupied peaks (±10 kb) and sorted in descending order of DYRK1A occupancy. (D) Analysis of DYRK1A, p300 and CBP ChIP-seq data as in (C), but centered at TSS of the nearest gene and extends (±10 kb) on each side. (E) Genome browser track example showing CBP, p300 and DYRK1A ChIP-seq signal in T98G cells. Bottom track shows DYRK1A ChIP-seq signal in HeLa cells. 16 and 42 are arbitrary units depicting enrichment in genome tracks. (F) ChIP analysis shows enrichment of DYRK1A, CBP and H3K27acetylation at enhancer sites upstream to DNAJC12, WNT11, and DYNC1H1 in HEK293 cells. Data represent the mean ± SD (n = 3 biological replicates). Student's t test were done to compare samples. P value = * (P < 0.05). (G) GO term analysis of genes located near or downstream to DYRK1A occupied peaks.

