Figure 1.
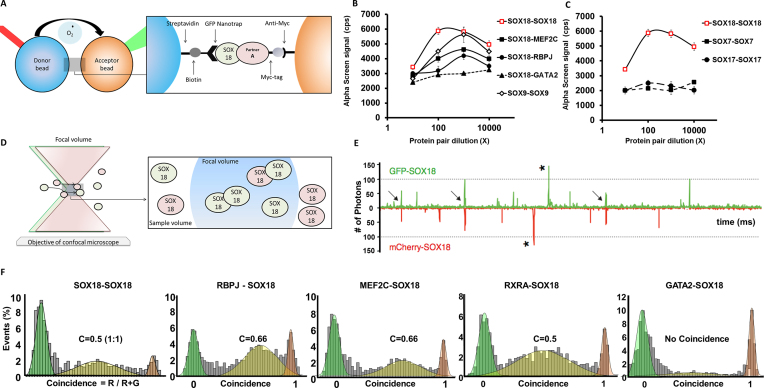
In Vitro characterization of the SOX18 dimer. (A) Schematic representation of the AlphaScreen assay showing interaction between SOX18 and co-factor A. This bead–bead assay relies on transfer of singlet oxygen from a donor bead to a luminescent acceptor bead when protein–protein interactions bring the beads within 200 nm (37) (see ‘Materials and methods’) (B) Typical AlphaScreen curves obtained for a non-interacting pair (GFP-SOX18 and GATA2-Cherry-myc) and for interacting pairs such the homodimer of SOX9 and GFP-SOX18 with respectively mCherry-myc SOX18, MEF2C and RBPJ. (C) Representative plots of AlphaScreen signal as a function of concentration for SOX18, SOX7 and SOX17 homodimers. (D) Schematic representation of single-molecule fluorescence experiment in which the proteins freely diffuse in and out of the focal volume created by two lasers simultaneously exciting the GFP and Cherry fluorophores. (E) Example of a single-molecule trace obtained after co-expression of SOX18-GFP and SOX18-Cherry. The numbers of photons detected in green and red channels are plotted as a function of time. The trace shows simultaneous bursts in both GFP and Cherry channels that reflect formation of dimers containing both fluorophores (arrows). (F) Histogram of single-molecule coincidence between respectively SOX18-GFP and SOX18-Cherry, MEF2C-Cherry, RBPJ-Cherry, RXRA-Cherry and GATA2-Cherry. In this experiment, GFP-labelled and Cherry-labelled protein were expressed separately in LTE then mixed together and allowed to interact for 1h before the assay. In all cases, the mixtures were diluted to pM concentrations immediately before testing. A fluorescence signal was recorded in the GFP channel and the Cherry channel over 500 s. The signal was then analyzed as a succession of individual events. For each event, a ratio of Cherry fluorescence to the total fluorescence is calculated. The number of events for each ratio C was counted and normalized to the total number of events. This fraction of events P(C) is plotted as a function of coincidence ratio (C). Gaussian curves are overlayed on the histograms: the green Gaussian curve corresponds to GFP only, the red Gaussian to Cherry only; the yellow Gaussian highlights the presence of both GFP and Cherry in the focal volume.

