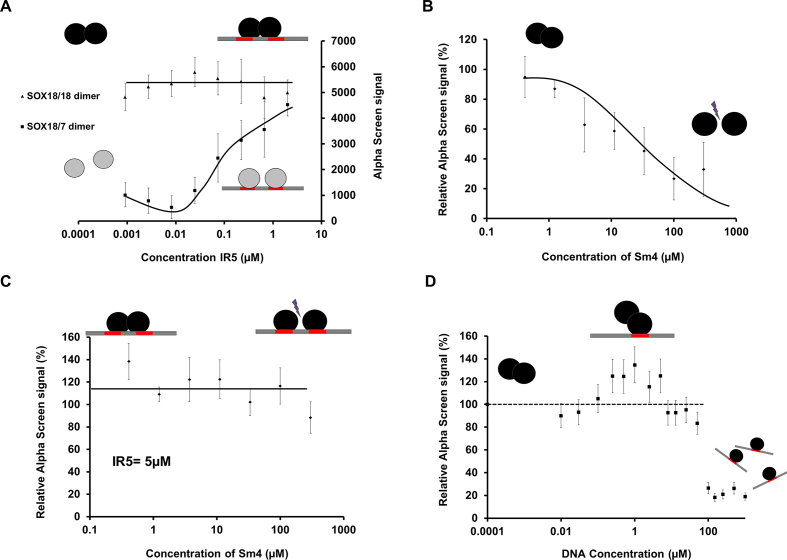
Figure 5.
SOX18 dimerization on IR5 is not a juxtaposition event. In all cases, the black circles represent SOX18 WT, the grey circles correspond to the SOX18DIM/SOX7 swap constructs, the straight black line represents the double-stranded DNA on which the red rectangles are single consensus sequences. (A) Maximum AlphaScreen signal for the SOX18 constructs as a function of the consensus sequence IR5 concentration (μM). Addition of the IR5 motif in the SOX18 WT assay produced a minor change in the signal until saturation of the DNA was reached. In contrast, with the SOX18DIM/SOX7-swap mutant, as the concentration of IR5 increased, the AS signal steadily increased to reach the signal observed with the SOX18 WT. Note that the signal is restored to the level of SOX18 WT for IR5 concentration >1.5 μM. (B) Maximum AlphaScreen signal for SOX18 WT as a function of concentration of Sm4. Sm4 significantly disrupts the SOX18 homodimer in the absence of IR5 motif-containing DNA, with IC50 value around 3 μM (35). (C) Maximum AlphaScreen signal for SOX18 WT as a function of concentration of Sm4 and in the presence of a fixed concentration of IR5-containing DNA (5 μM). At this DNA concentration, the AS signal intensity was not perturbed upon addition of Sm4 up to 100μM. (D) Maximum AlphaScreen signal for SOX18 WT as a function of concentration of single DNA consensus sequence (μM). As the DNA concentration increases, the AS signal intensity increases slightly until 1μM then the signal decreases as SOX18 binds to individual DNA strands.

