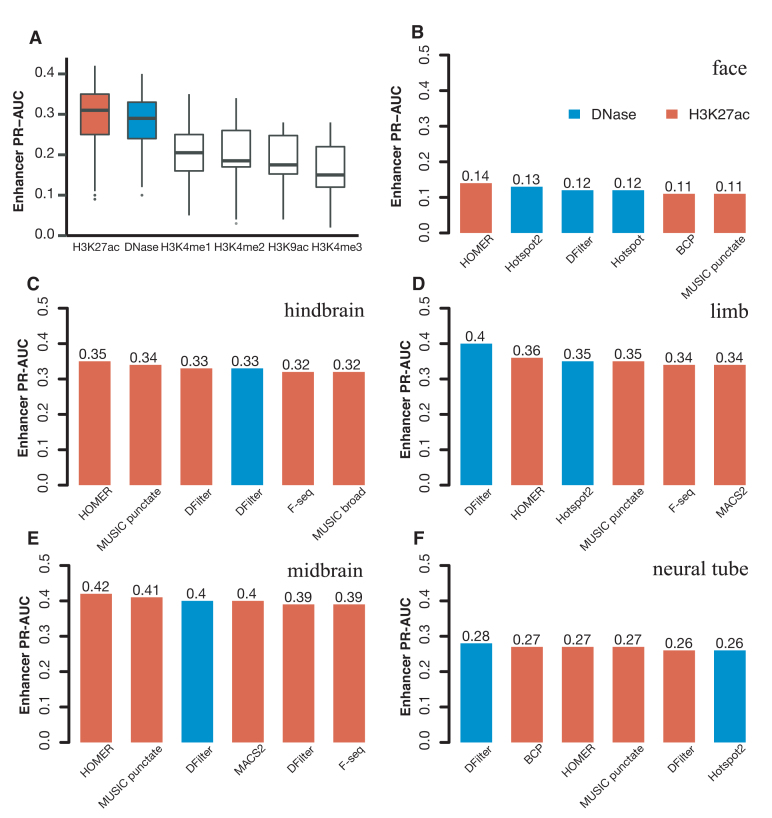
Figure 1.
The performance of H3K27ac and DNase-seq peaks for predicting VISTA enhancers in the corresponding tissue, assessed by PR-AUC values. Final, resized, TSS-distal peaks were used for comparing the peak calling algorithms. (A) Boxplots of the comparison of DNase peaks (four algorithms in five tissues) with the peaks of five histone marks (eight algorithms in the same five tissues). (B–F) Barplots of the top six methods for DNase peaks (blue) and H3K27ac peaks (red) in (B) face, (C) hindbrain, (D) limb, (E) midbrain and (F) neural tube.

