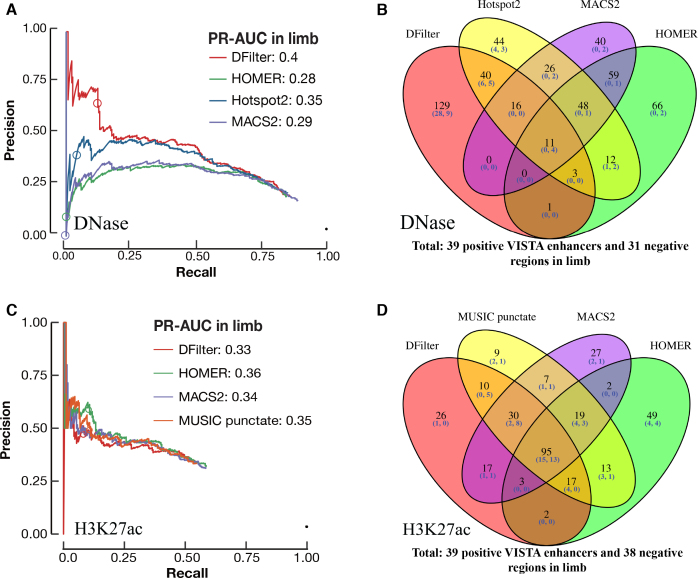
Figure 2.
Identifying VISTA enhancers in limb using DNase-seq and H3K27ac peaks. Final, resized, TSS-distal peaks were used for comparison. The circle in each PR curve indicates the 200th prediction. (A) PR curves for DNase peak callers. PR-AUC values are indicated in the legend. (B) Venn diagram of the top 200 peaks by each DNase peak callers. Among the top 200 peaks called by DFilter, 129 were not called by the other three algorithms. (C) PR curves for four H3K27ac peak callers. PR-AUC values are indicated in the legend. (D) Venn diagram of the top 200 peaks by each of the four H3K27ac peak callers.

