
FIGURE 5.
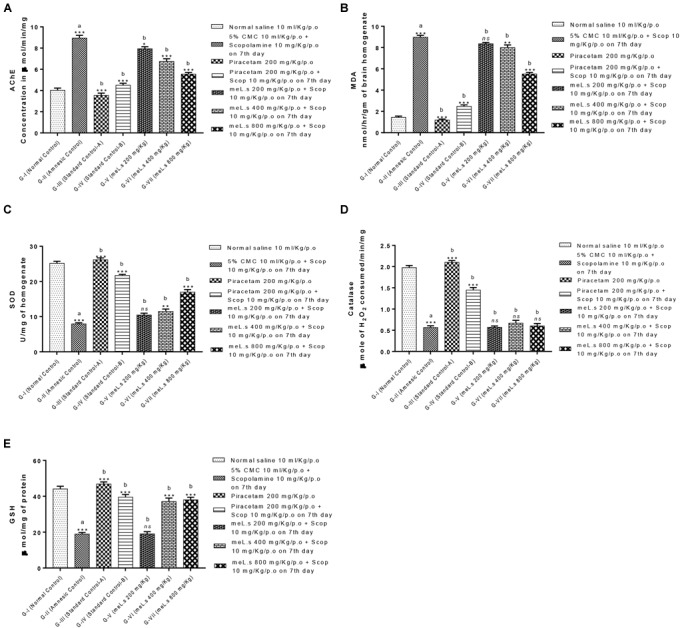
Effect of meL.s on concentration of (A) acetylcholinesterase (AChE), (B) MDA, (C) SOD, (D) CAT, and (E) GSH in brain homogenate. All values were expressed as mean ± SEM with n = 6 per group. One-way ANOVA followed by Dunnett’s test was applied on data set and G-II was compared with G-I (presented by sign “a” on bar) while other groups (G-III to G-VII) were compared with G-II (presented by sign “b” on bars). Value of P ≥ 0.05 was shown by marking “ns” while P-values ≤0.05, ≤0.01, and ≤0.001 were expressed as ∗, ∗∗, and ∗∗∗, respectively.