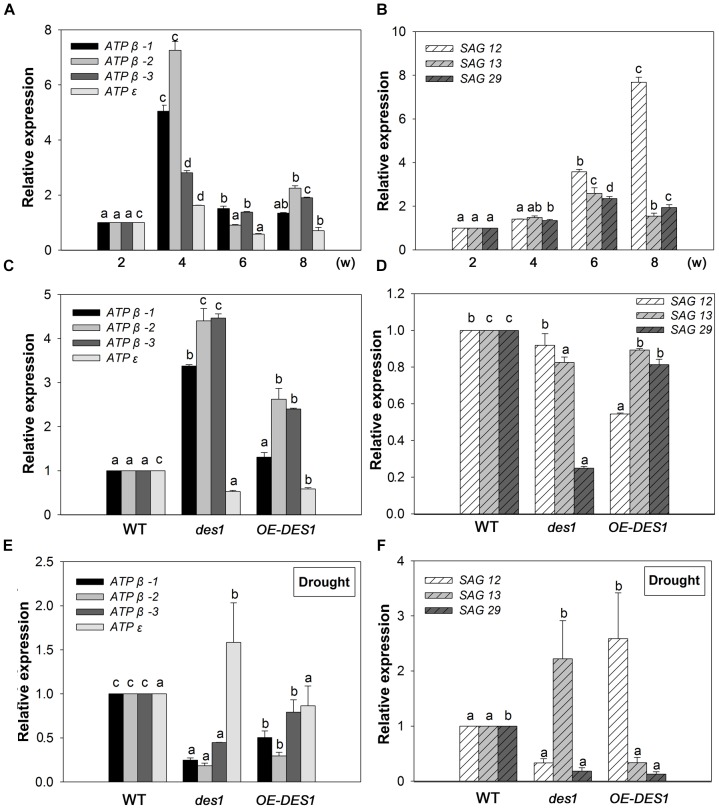
FIGURE 2.
Expression patterns of SAGs and ATP synthase-related genes. (A) Expression patterns of ATP synthase-related genes at different developmental stages. (B) Expression patterns of SAGs at different developmental stages. (C) Effects of endogenous H2S on the expression levels of ATP synthase-related genes. (D) Effects of endogenous H2S on the expression levels of SAGs. (E) Expression levels of ATP synthase-related genes under drought-stress conditions in WT, des1 and OE-DES1. (F) Expression levels of SAGs under drought-stress conditions in WT, des1 and OE-DES1. Data are means ± SEs of three independent experiments; bars marked with the same letter did not differ significantly at p < 0.05.

