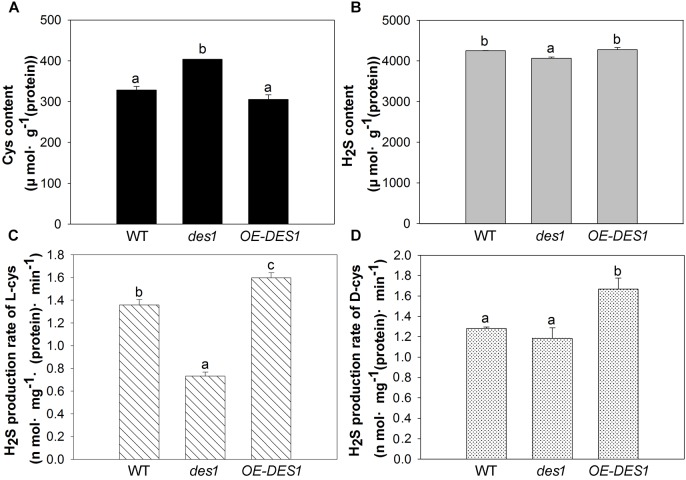
FIGURE 5.
Effects of drought stress on the H2S-related physiological indices in the mitochondria of WT, des1 and OE-DES1. Leaves of 4-week-old after withholding water for 1 week were collected and the mitochondria were isolated and purified. (A) Cys contents of mitochondria were quantitated by the method described previously (Fu et al., 2012). (B) H2S contents of mitochondria were measured with electrodes (TBR4100 WPI, Sarasota, FL, United States). (C) H2S production rates of L-Cys and (D) H2S production rates of D-Cys in mitochondria of WT, des1 and OE-DES1 were measured with methylene blue method (Fu et al., 2012). Data are means ± SEs of three independent experiments; bars marked with the same letter did not differ significantly at p < 0.05.

