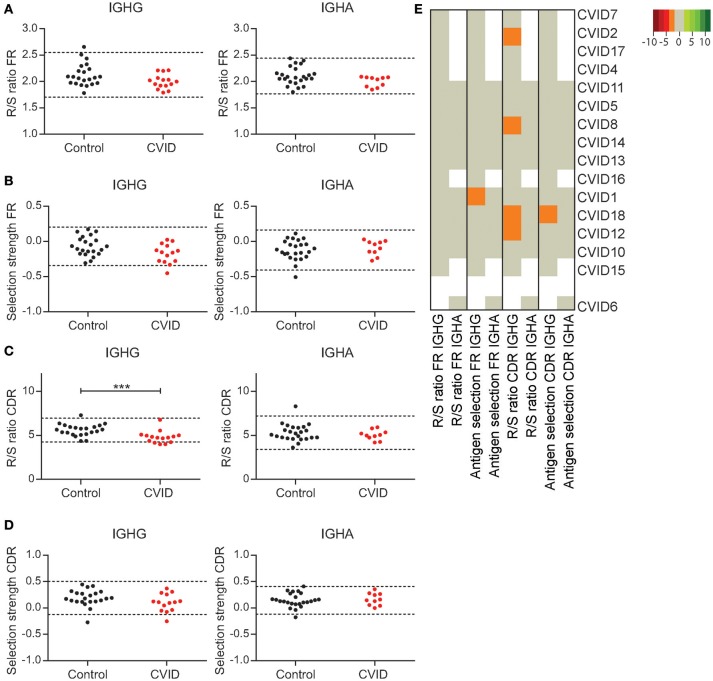
Figure 4.
CVID patients show minor alterations in GC selection. The R/S ratio (A) and selection strength as analyzed by BASELINe (B) in the FR region of IGHA and IGHG transcripts. (C) The R/S ratio in the CDR regions of IGHA and IGHG transcripts. (D) The BASELINe selection strength in the CDR regions. Dotted lines in graphs (A–D) represent the mean plus and minus 2 st dev. Statistical significance is performed using a Mann Whitney-test and indicated using ***P < 0.0005. (E) Heatmap representing all outcomes for antigen selection per patient. Values below 2 st dev from the mean of the HC samples are indicating by orange, while larger deviations from the mean are indicated by darker shades of red. Values above 2 st dev from the mean are indicated with green with darker green representing increased deviation from the HC population. Patients are clustered based on all antigen selection parameters included.

