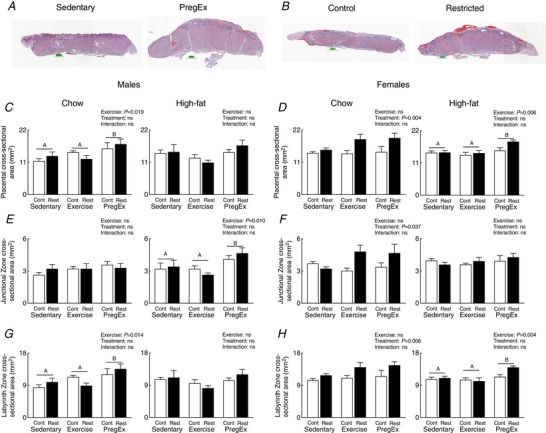
Figure 3. Placental histology parameters.

Representative whole placental images demonstrating morphological changes following PregEx compared to Sedentary (male placentae from Chow‐fed mothers) (A) and in Restricted compared to Control (B) placentae (female placentae from Exercise mothers). Whole placental (C and D), junctional zone (E and F) and labyrinth (G and H) cross‐sectional areas in male‐ and female‐associated placentae whose mothers were Control (open bars) or Restricted (black bars) and consumed a Chow (left panel) or High‐fat diet (right panel) (n = 3–4 in each group/sex n = 1 representing one pup from one litter). Data were analysed by a two‐way ANOVA and presented as mean ± SEM. Differences across exercises are denoted by different letters where ‘A’ is different from ‘B’, but not ‘AB’. [Color figure can be viewed at http://wileyonlinelibrary.com]
