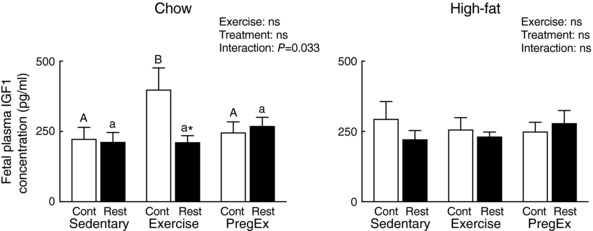
Figure 4. Fetal IGF1 concentrations.

Pooled plasma IGF1 concentrations in fetuses from Chow (left) and High‐fat (right) fed mothers (n = 8–10 litters in each group). Data were analysed by a two‐way ANOVA and presented as mean ± SEM, where ‘ns’ is not significant. * P<0.05 vs. Control and differences across exercises are denoted by different letters where ‘a/A’ is different from ‘b/B’.
