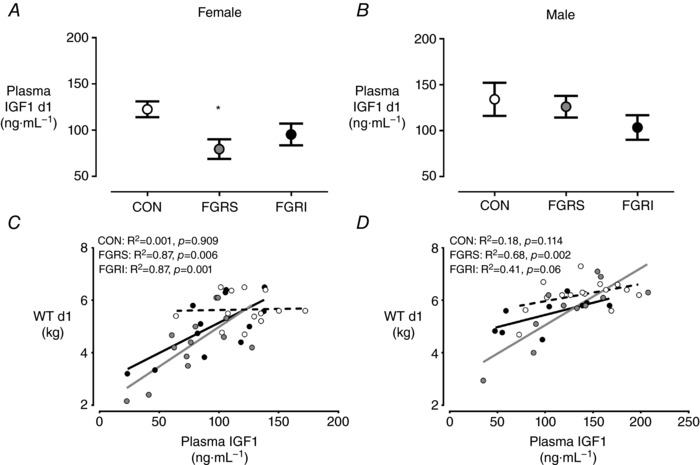
Figure 6. Plasma IGF1 characteristics at birth.

Plasma concentrations of IGF1 in females (A) and males (B), and their correlation with weight at birth (C and D, respectively). Female CON (white) n = 13, FGRS (grey) n = 13, FGRI (black) n = 12, and male CON (white) n = 15, FGRS (grey) n = 11 and FGRI (black) n = 9 lambs. Data are means ± SEM. Symbols refer to post hoc P values for differences between experimental groups (ANOVA: CON vs. FGRS: * P < 0.05).
