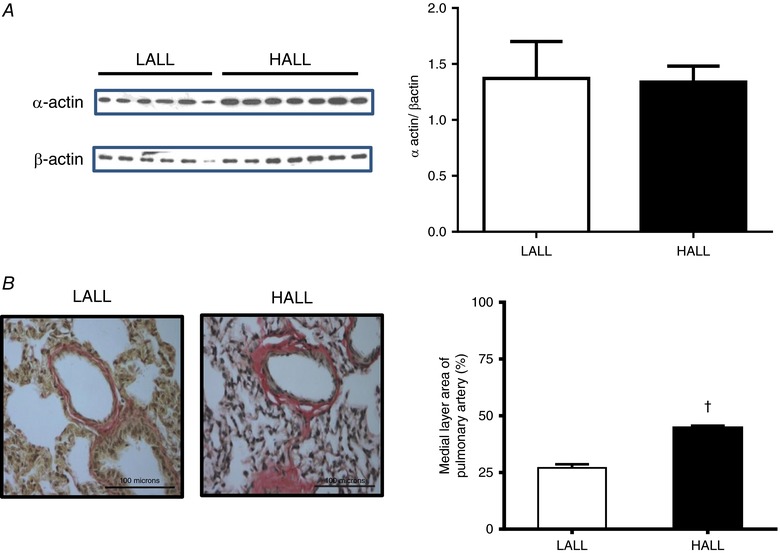
Figure 9. Pulmonary α‐actin expression and medial layer area of pulmonary arteries in lowland (LALL) and highland (HALL) newborn llamas.

A, immunoblot determination of α‐actin and β‐actin; B, van Gieson staining and medial layer area of pulmonary arteries; open bars, LALL; closed bars, HALL. Values are means ± SEM. Significant differences (P < 0.05, unpaired t test): †LALL vs. HALL. [Color figure can be viewed at http://wileyonlinelibrary.com]
