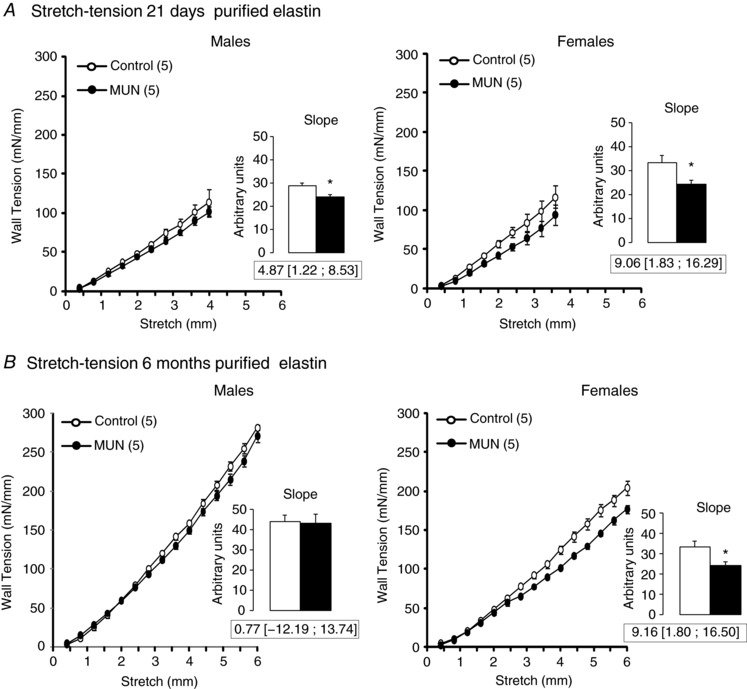
Figure 6. Mechanical tests on purified aortic elastin.

A, mean stretch–tension relationship in 21‐day‐old rat aorta. B, mean stretch–tension relationship in 6‐month‐old rat aorta. Inset shows the mean slope values. MUN, maternal undernutrition. The number of dams is shown in parentheses (2 pups from each dam were used). Bar graphs represent the mean, and error bars are SEM. Mean differences between Control and MUN groups are shown below each graph together with confidence intervals (* P < 0.05 when compared to sex‐ and age‐matched Control rats).
