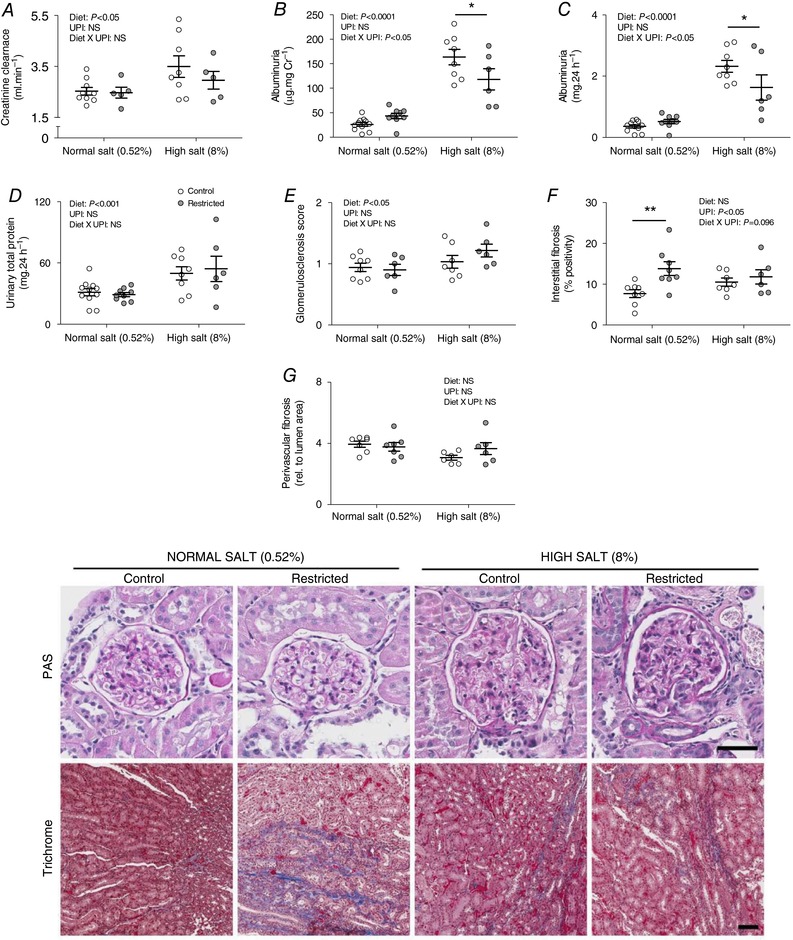
Figure 3. Kidney function and histopathology following 6 weeks of a high salt diet.

Creatinine clearance (A), albuminuria (B and C), proteinuria (D), glomerulosclerosis (E), tubulointerstitial fibrosis (F) and perivascular fibrosis (G) following 6 weeks of diet intervention (26 weeks of age). Data are individual values with the mean ± SEM. * P < 0.05, ** P < 0.01 Restricted vs. Control within diet group by Fisher's LSD test. UPI, uteroplacental insufficiency; NS, not significant. Representative kidney sections stained with PAS and Masson's trichrome. Scale bars = 50 μm.
