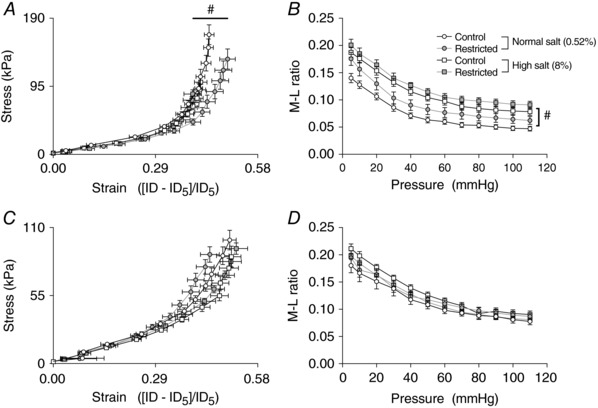
Figure 4. Passive mechanical wall properties of mesenteric and renal arteries following 6 weeks of a high salt diet.

Stress–strain relationships (A and C) and media‐to‐lumen ratio (B and D) for mesenteric (top) and renal (bottom) arteries following 6 weeks of diet intervention (26 weeks of age). Data are the mean ± SEM; n = 10–11 per group. #P < 0.05 High vs. Normal salt within uteroplacental insufficiency group by Tukey's post hoc test.
