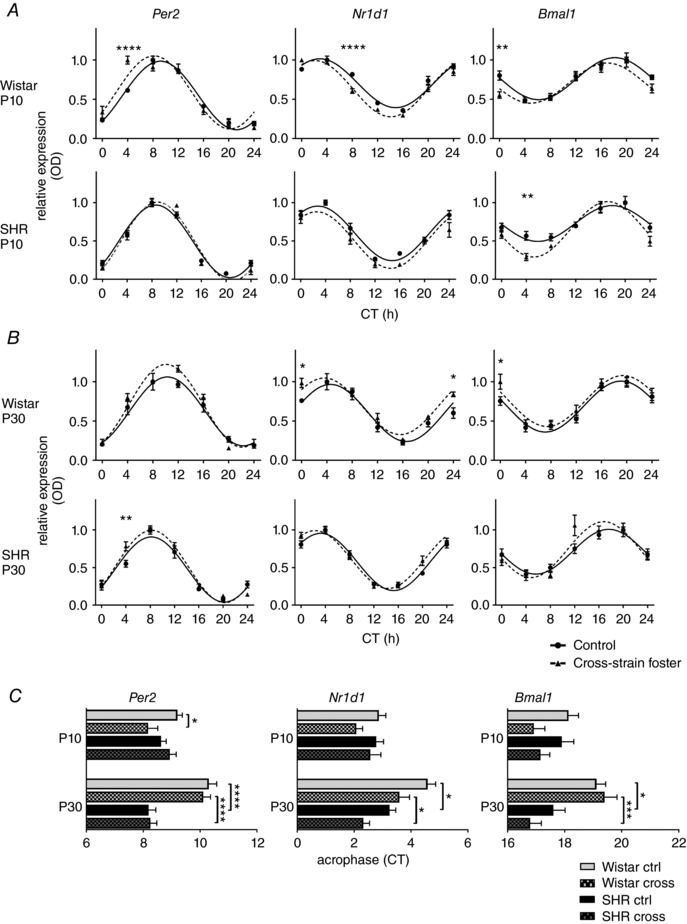
Figure 2. The effect of cross‐strain fostering on the clock gene expression in the SCN of pups.

Daily Per2, Nr1d1 and Bmal1 expression profiles were analysed in 10‐day‐old (A) and 30‐day‐old (B) Wistar rat or SHR pups reared by their genetic mothers as control (full circles, full line) or exposed to cross‐strain fostering (full triangles, dashed lines). The pups were killed at 4 h intervals over 24 h. Time is expressed as circadian time (CT); CT0 represents the time of lights on in the previous LD 12:12 h cycle. The data are expressed as the mean ± SEM (n = 3–5 per time point). The results of two‐way ANOVA (Table 1) post hoc analyses (Šidák's multiple comparisons) depict differences in the expression levels between the control and cross‐strain fostered groups at individual CT. C, comparison of acrophases (mean ± SEM) of the gene expression profiles shown in (A) and (B) by two‐way ANOVA with Tukey's multiple comparisons test; the relevant significant differences are depicted. * P < 0.05; *** P < 0.001; **** P < 0.0001.
