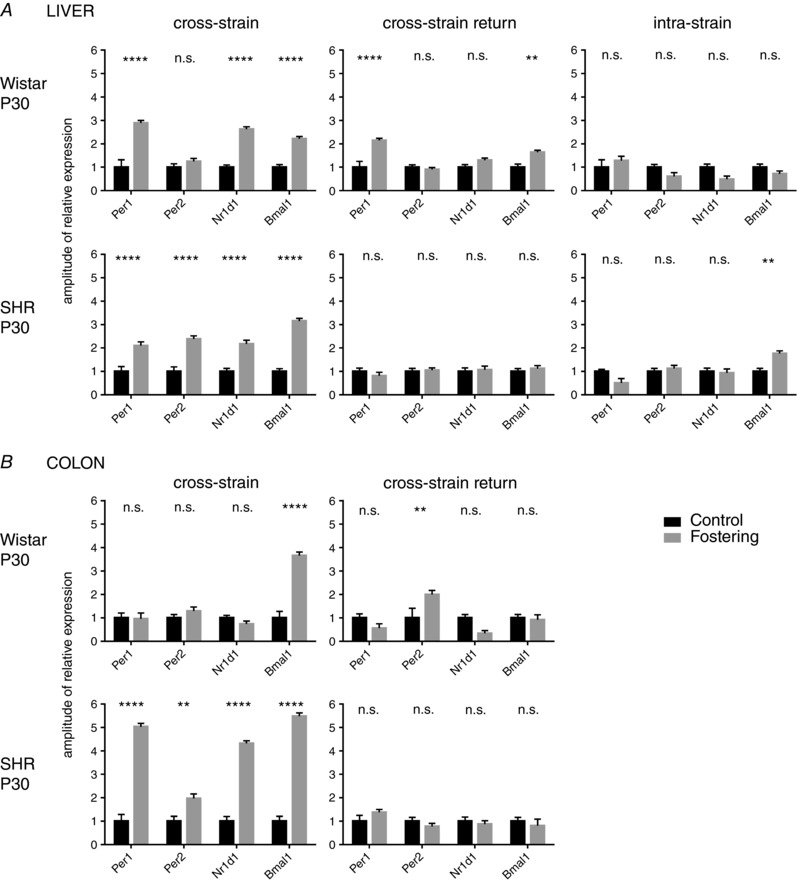
Figure 5. Amplitudes of the cosine fits of the Per1, Per2, Nr1d1 and Bmal1 expression profiles.

Amplitudes of the cosine fits of the Per1, Per2, Nr1d1 and Bmal1 expression profiles in the liver (A) and colon (B) of 30‐day‐old (P30) Wistar rat and SHR pups. For each clock gene, the amplitudes from pups reared by their own mother (control) were normalized and compared with profiles from pups reared by a foster mother of the other (cross‐strain fostering) or same (intra‐strain fostering) strain or with pups who were first exposed to cross‐strain fostering and at 10 days of age returned back to their genetic mother (cross‐strain return). The data are expressed as the mean ± SEM. The results of comparisons between groups by two‐way ANOVA with Šidák's multiple comparisons test are shown. ** P < 0.01; *** P < 0.001; **** P < 0.0001.
