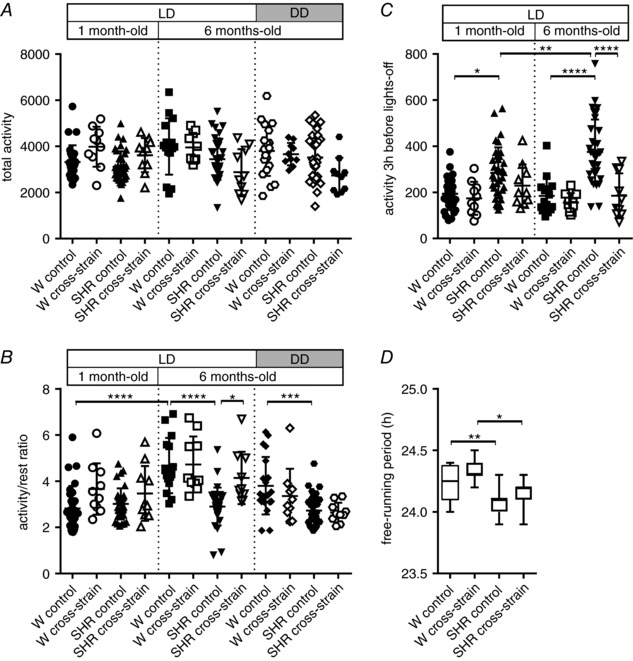
Figure 7. Analyses of locomotor activity parameters of 1‐ and 6‐month‐old Wistar rats and SHR maintained under a LD regime or DD.

Total activity (A), activity/rest ratio (B), activity in the 3‐h interval before lights‐off (C) and free‐running period (D) were measured in rats that were reared until weaning by their own mothers (control) and in those that were exposed to cross‐strain fostering (cross‐strain). The data are expressed as the mean ± SD (n = 10–35 per group); box plots in (D) show median (line) with 25th to 75th percentile (box) and minimal to maximal value (whiskers). The results of the statistical comparisons between groups are depicted. * P < 0.05; *** P < 0.001; **** P < 0.0001.
