
Figure 1. Time sequence of changes in MAP, FHR and skewness.
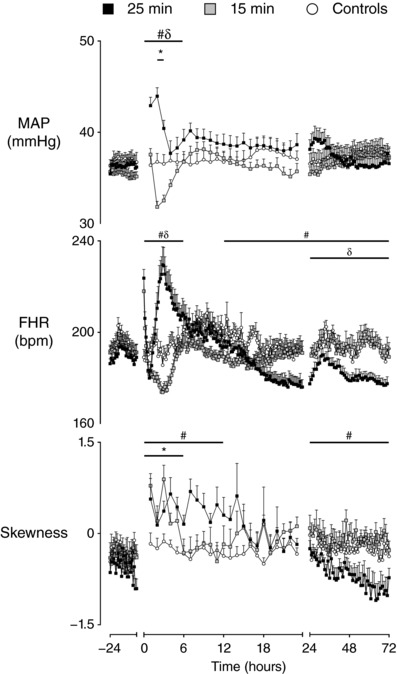
Time sequence of changes in MAP (mmHg), FHR (bpm) and skewness of R‐R intervals from 24 h before until 72 h after umbilical cord occlusion in sham controls (n = 12), 15 min group (n = 10) and 25 min group (n = 17). Data are the 1 h mean ± SEM. FHR is the 10 min mean ± SEM during the first 24 h after occlusion. * P < 0.05, 15 min vs. controls; # P < 0.05, 25 min vs. controls; δ P < 0.05, 15 min vs. 25 min.