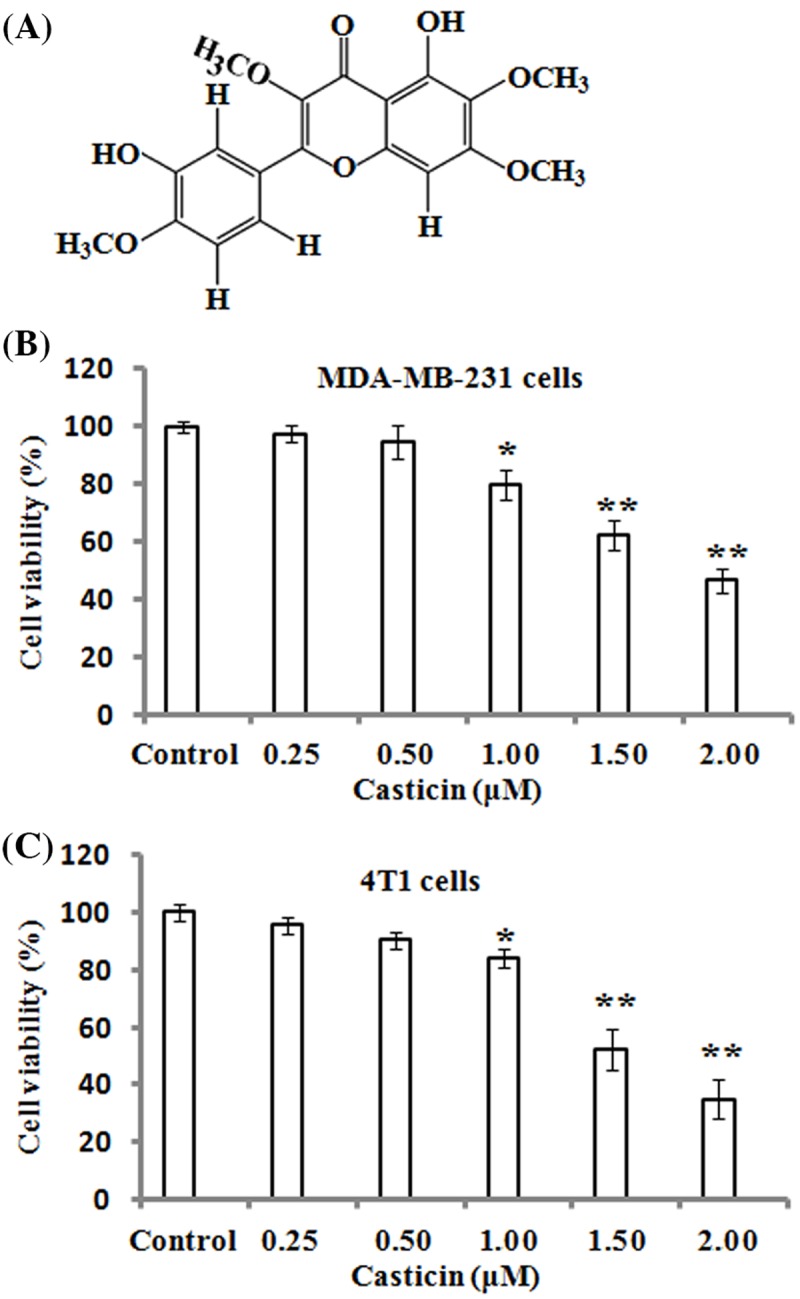
Figure 1. Effects of casticin on the viability of breast cancer cells.

(A) Chemical structure of casticin. (B,C) MDA-MB-231 and 4T1 cells were respectively treated with various concentrations (0, 0.25, 0.50, 1.00, 1.50, and 2.00 µM) of casticin for 24 h, and cell viability was determined by MTT assays. The results represented the mean ± S.D. of three independent experiments. *P<0.05 and **P<0.01 compared with the control (0 µM of casticin).
