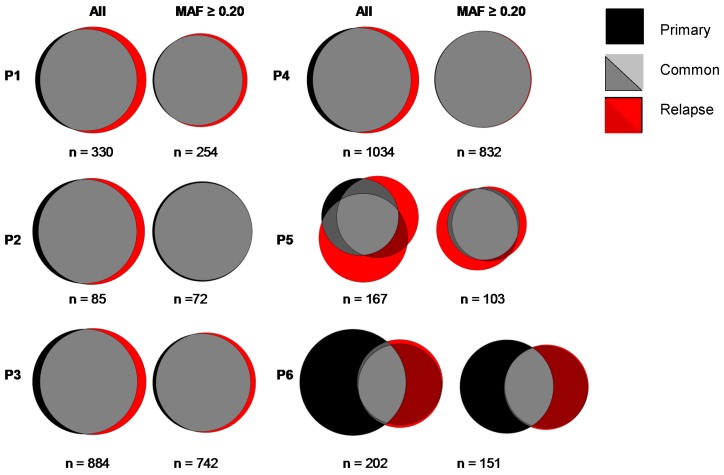
Figure 2.
Venn diagrams showing for each individual patient (P1–6) the overlap in mutations between primary and paired relapse tumor samples. Left panels are Venn diagrams for all mutations (all), and right panels are Venn diagrams for mutations with a mutant allele frequency (MAF) ≥0.2. The total numbers of mutations per patient are depicted below each diagram. The size of the relapse diagram is proportional to the primary sample. In the patients with two biopsies at relapse (P5 and P6), the concordance between the novel mutations in the relapse samples was 45.3% and 89.2%, indicative of spatial heterogeneity.

