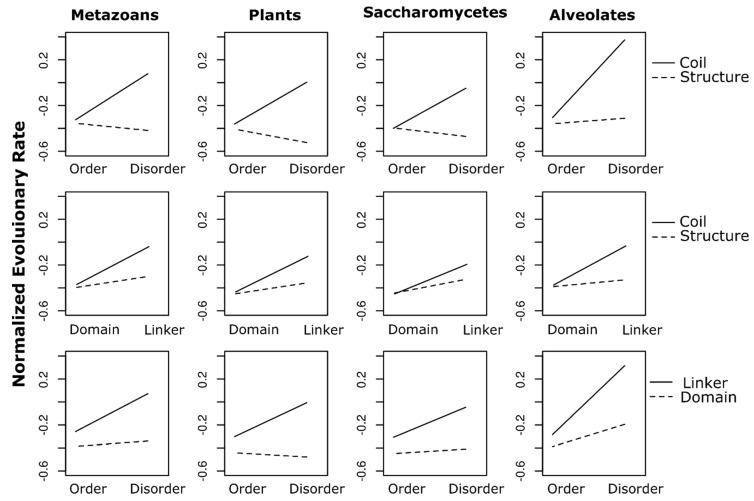
Figure 3.
Trace plots illustrating first-order interactions among all site-wise binary factor levels: order (Order) and intrinsic disorder (Disorder), secondary structures (Structure) and random coils (Coil), functional domains (Domain) and interdomain linkers (Linker). Trace factors (solid vs. dashed lines) are indicated to the right of each row of plots. Vertical columns of plots correspond to each of the four datasets (indicated) above. Y-axes represent mean normalized evolutionary rates.

