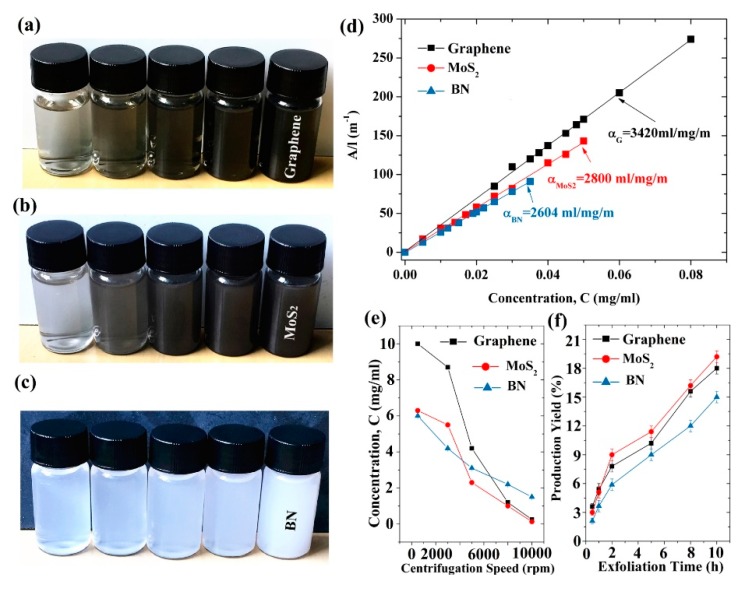
Figure 25.
Photographs of aqueous dispersions of graphene (a), MoS2 (b), and BN (c) with different concentrations after centrifugation at 500–10,000 rpm for 30 min; (d) Lambert–Beer plots for graphene, MoS2, and BN; (e) dependence of 2D material concentration on centrifugation speed for the supernatant; (f) dependence of 2D material production yield on exfoliated time. Reproduced from [53]. Copyright IOP Publishing, 2017.

