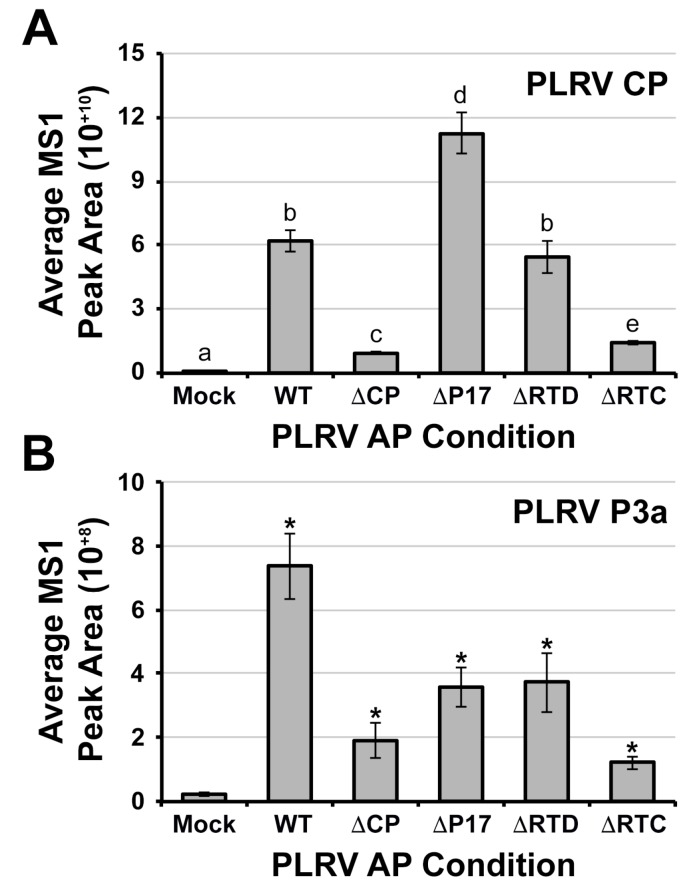
Figure 1.
Label-free quantification of PLRV coat protein domain (CP) and P3a in α-PLRV affinity purifications (AP) from leaf tissue infected with WT or PLRV mutants. Bar graphs show the average relative protein abundance of (A) CP and (B) P3a quantified from the integration of MS1 (precursor ion) peak areas (unit-less) for protein specific peptides detected in AP samples from each of the PLRV infection conditions (n = 6 analytical replicates representing three biological replicates). The level of background noise in mock-infected tissue is shown. The number of peptides used for the quantification of protein abundance are CP = 10 and P3a = 2 (Supplemental Table S1). Error bars represent ± the average standard error. Lowercase letters represent significant differences (p < 0.05) measured by (A) Kruskal-Wallis rank sum test followed by a Conover post-hoc pairwise multiple comparison, which was further adjusted by the Holm FWER method and (B) by two-tailed, Wilcoxon signed-rank sum test compared to the mock-infected control where * p < 0.05.

