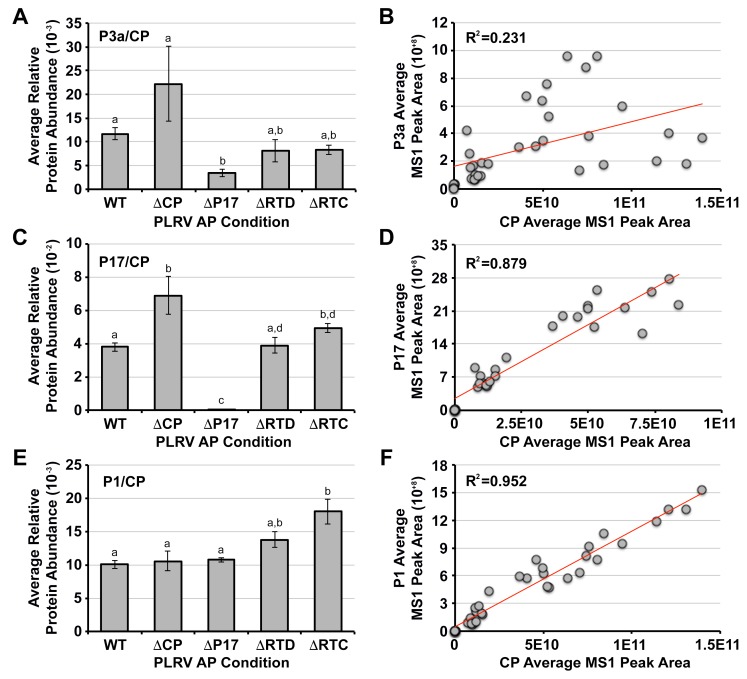
Figure 2.
Comparative analysis of WT and mutant PLRV affinity purifications (AP) shows partial loss of P3a when P17 is absent. (A,C,E) Bar graphs show the average, relative protein abundance measured by MS1 peak area integration (unit-less) of (A) P3a, (C) P17 movement protein, and (E) P1 polyprotein in AP samples for each of the PLRV infection conditions normalized to the levels of the PLRV coat protein domain (CP) in those same samples. Error bars represent the ± standard error. Lowercase letters represent a significant difference (p < 0.05) measured by a Kruskal-Wallis rank sum test followed by a Conover post-hoc pairwise multiple comparison, which was further adjusted by the Holm FWER method; (B,D,F) Linear regression analysis between the average, relative levels of CP, and (B) P3a, (D) P17, and (F) P1 measured by MS1 peak area integration in each of the analytical AP replicates per PLRV infection condition. The coefficient of determination (R2) is given for each regression line (red). Values for P17 and CP in the ΔP17 null-mutant APs were not included in panel (D) since P17 was not detected above background noise in these samples (see panel C). The number of peptides used for MS1 peak area integration are: CP = 10, P3a = 2, P17 = 2, and P1 = 4 (Supplemental Table S1).

