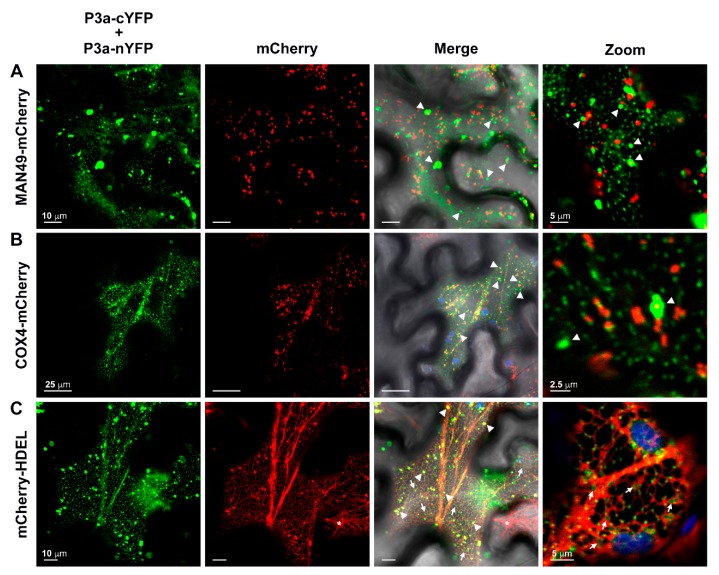
Figure 7.
The C-terminally-tagged P3a homodimer localizes to structures associated with the endoplasmic reticulum. The panels represent single-plane confocal micrographs of N. benthamiana leaf epidermal cells co-expressing the bimolecular fluorescence complementation (BiFC) constructs P3a-cYFP plus P3a-nYFP with (A) the cis-Golgi marker MAN49-mCherry; (B) the inner mitochondrial membrane marker COX4-mCherry; or (C) the mCherry-HDEL, which labels the endoplasmic reticulum (ER) network. The overlap of YFP (green) and mCherry (red) fluorescence images with the corresponding brightfield image is shown in the column labeled merge with co-localization appearing yellow. The column marked Zoom is a magnification of a selected region from the merged image within the same panel. White arrowheads highlight large YFP fluorescent aggregates while arrows mark regions of diffuse YFP single localized in the space between ER tubules. A white asterisk indicates a cell expressing mCherry-HDEL only. Chloroplast autofluorescence is highlighted in blue. Scale bars show the length indicated.

