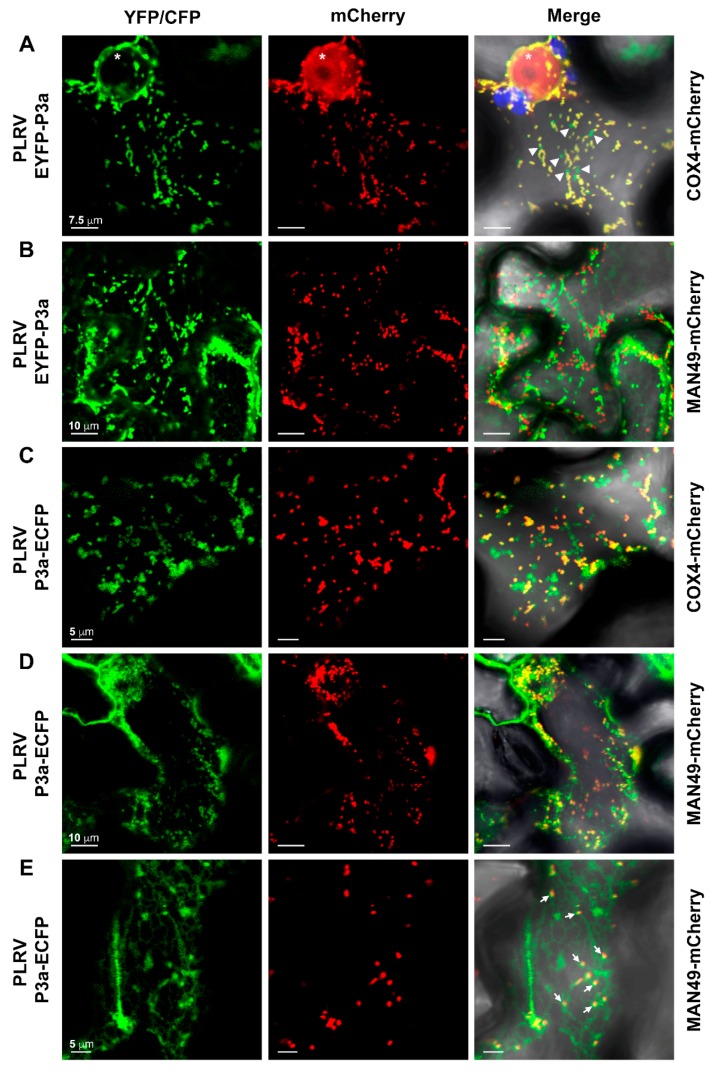
Figure 8.
Tag orientation of a full-length fluorescent protein fusion influences the localization pattern of PLRV P3a. The panels represent single-plane confocal micrographs of N. benthamiana leaf epidermal cells co-expressing (A,B) PLRV EYFP-P3a or (C,D) P3a-ECFP with (A,C) COX4-mCherry or (B,D,E) MAN49-mCherry. EYFP/ECFP fluorescence is falsely colored green with mCherry fluorescence in red. The overlap of EYFP/ECFP and mCherry fluorescence with the corresponding brightfield image is shown in the column labeled merge with co-localization of fluorescence appearing yellow. Chloroplast autofluorescence is highlighted in blue. White arrowheads indicate EYFP fluorescence independent of COX4-mCherry. A white asterisk marks the position of the nucleus. White arrows mark MAN49-mCherry labeled cis-Golgi partially co-localizing with P3a-ECFP at putative ER exit sites. Scale bars show the length indicated.

