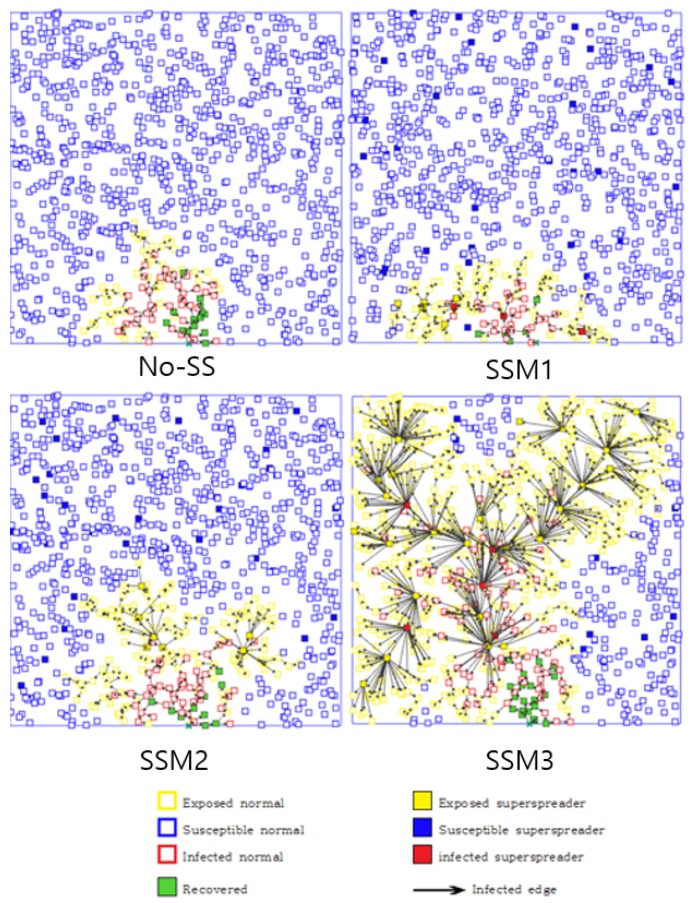
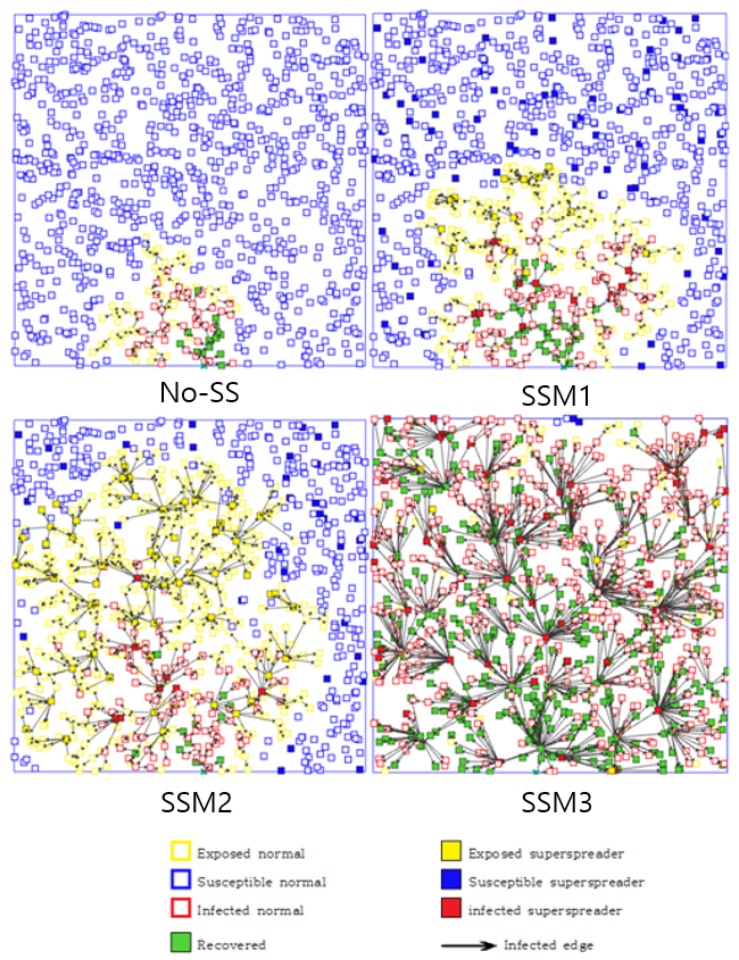
Figure 3.
Transmission dynamics of four model are demonstrated at day (super-spreaders are indicated by a filled box). Top four panels show the results using and bottom four panels show the results using . SSM 3 shows the fastest transmission pattern while No-SS shows the slowest (the difference becomes more significant as increases).


