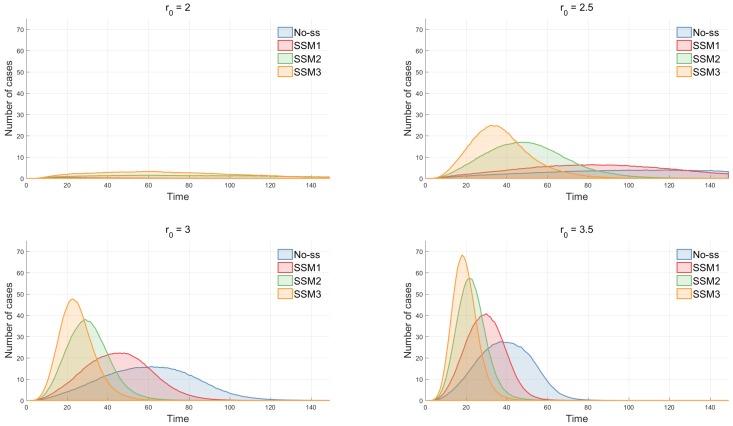
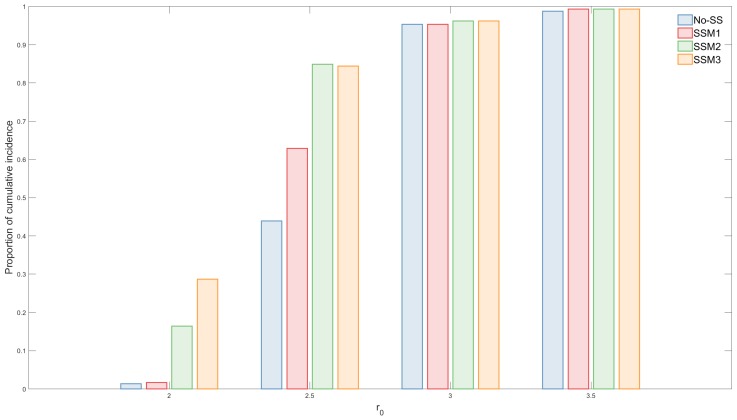
Figure 9.
The impact of the effective radius is shown under four models. In all models, the peak size increases rapidly as increases. The difference is most significant in SSM 3. The change of proportion of cumulative incidence while varying the different values of is shown that, in each model, the outbreak probability increases rapidly as reaches a certain range of values.


