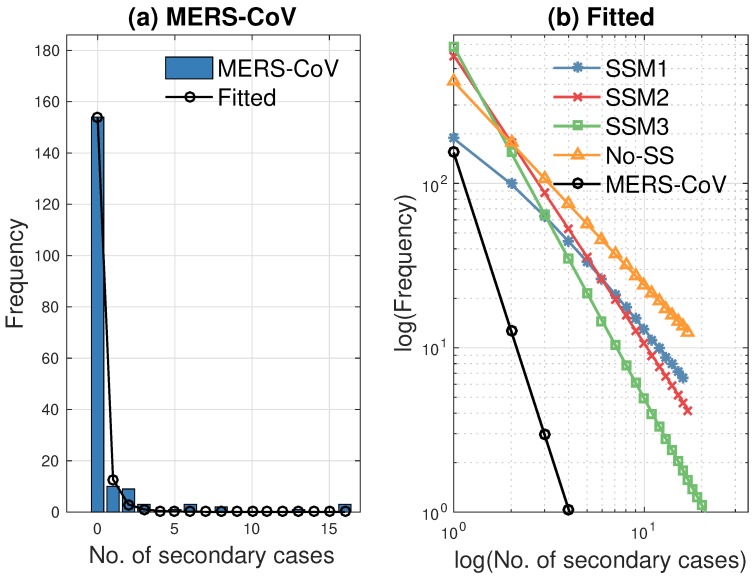
Figure 11.
(a) Distribution of secondary cases for the 2015 Korean MERS-CoV data and its fitted power law distribution are illustrated. (b) Four fitted power law distributions using are compared with MERS-CoV data. SSM3 shows the best fit to the distribution of secondary cases of the MERS-CoV data (see the slopes of the squared and circled lines).

