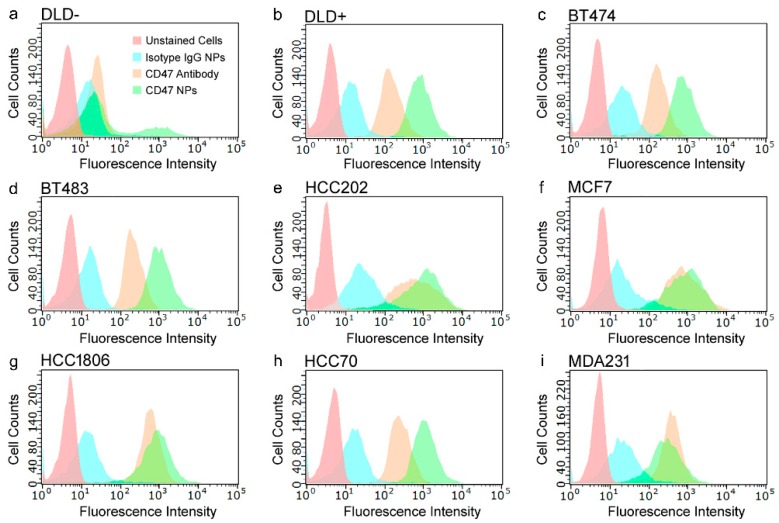
Figure 3.
FACS plots showing the fluorescence intensity associated with each cell line tested including: (a) DLD−; (b) DLD+; (c) BT474; (d) BT483; (e) HCC202; (f) MCF7; (g) HCC1806, (h) HCC70; and (i) MDA231. The following experimental groups were tested within each of the cell lines (1) Unstained cells (red), (2) cells incubated with IgG SERS NPs (blue), (3) cells incubated with CD47 antibody (orange), and (4) cells incubated with CD47 SERS NPs (green). FACS was used to assess which cell lines demonstrated significant binding with our CD47 SERS NPs.

