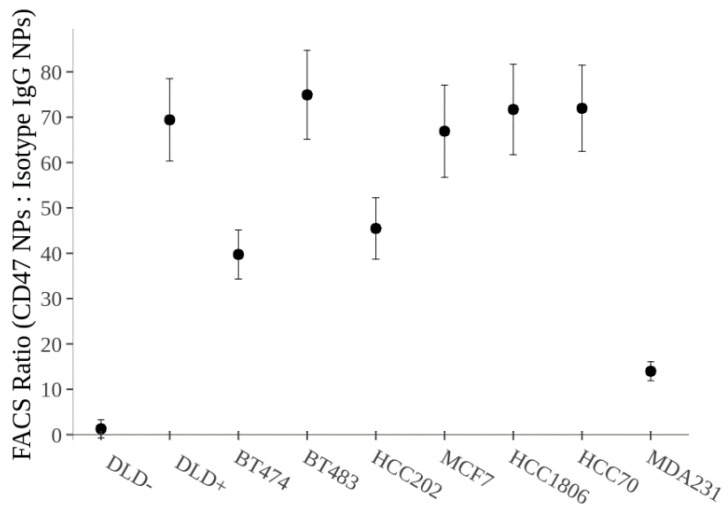
Figure 4.
FACS data showing the ratio of CD47 labeled SERS NPs to Isotype IgG labeled SERS NPs. This data reveals the specific binding of our CD47 SERS NPs to each of the cell lines. The Isotype NPs are acting as a control to reveal non-specific binding of the NPs to the cell surface. Note the significant difference (p < 0.01) between the negatively CD47 expressing cell line, DLD−, and the rest of the cell lines.

