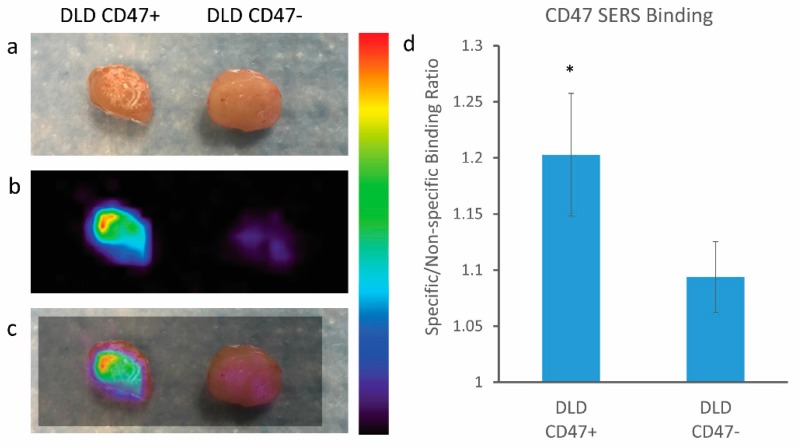
Figure 6.
Raman imaging of positive and negative CD47 expressing tissues (DLD+ and DLD−, respectively) harvested from mouse xenograft. (a) Digital photo of excised tissue after NPs administration; (b) Raman imaging of tissue samples; (c) overlay of Raman imaging with tissue sample, notice the increased NP binding in the tissue expressing CD47 as opposed to the negatively CD47 expressing tissue; (d) quantitative ratiometric analysis of specific CD47 SERS NP binding to non-specific Isotype IgG SERS NP binding on tissue samples Notice the significant differences represented by * (p < 0.05) between the positive control (DLD CD47+) and the negative control (DLD CD47−) tissues; error bars represent standard error of mean (SEM). Color bar to the right of Raman images represents Raman intensity, where red represents the highest Raman signal and black represents no associated Raman signal.

