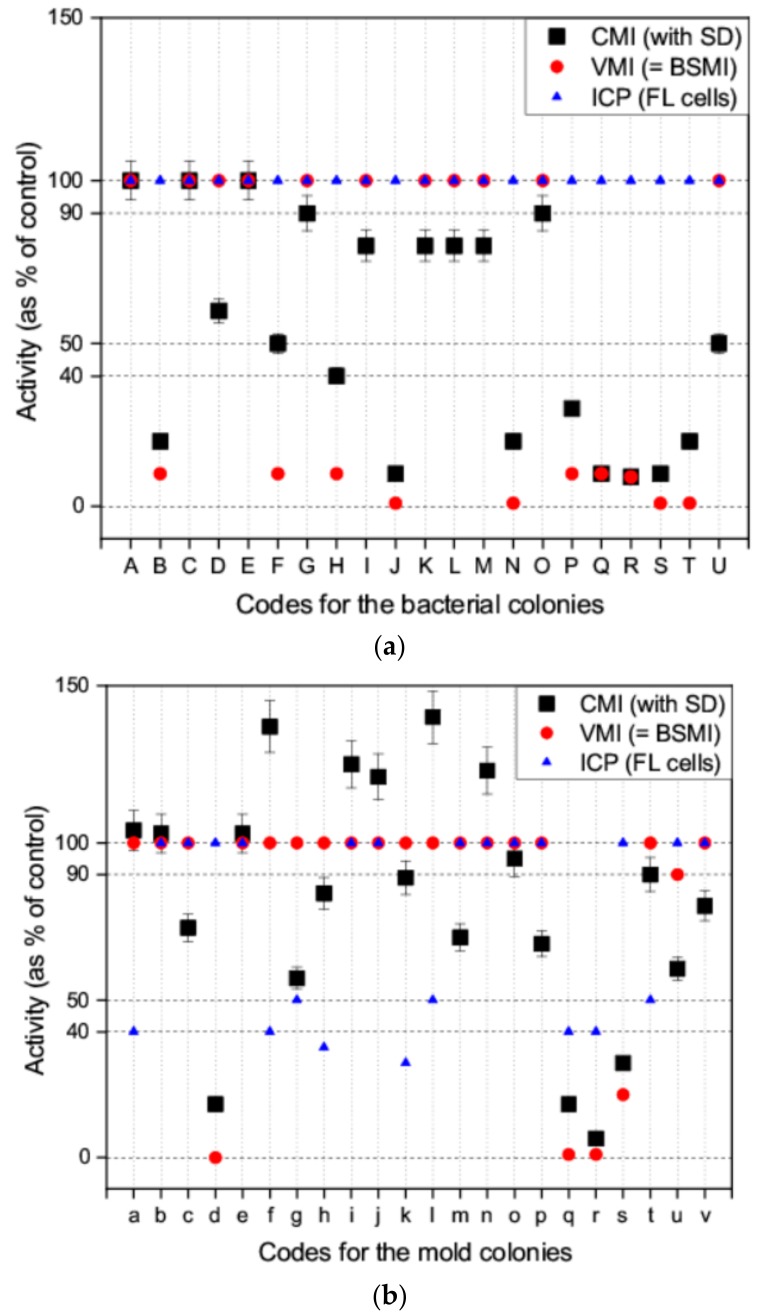
Figure 3.
Responses to the toxins measured as a decrease in activity provoked by bacterial colonies (a) and mold colonies (b) and analyzed using four toxicity assays. The VMI and BSMI assays (red circle) demonstrated the inhibition of spermatozoa motility, subjectively by visual inspection. The red circles indicate the findings of the VMI and BSMI assays (identical results). The CMI assay (black square) shows the objective measurement of the inhibition of spermatozoa motility using a computed MATLAB® algorithm. The mean of the three parallel measurements is shown; the SD is depicted as an error bar. The ICP assay (blue triangle) shows the inhibition of cell proliferation in the somatic FL cell lines. The decrease in motility was estimated from four digital videos. The mean of the three measurements is shown (SD was <20%).

