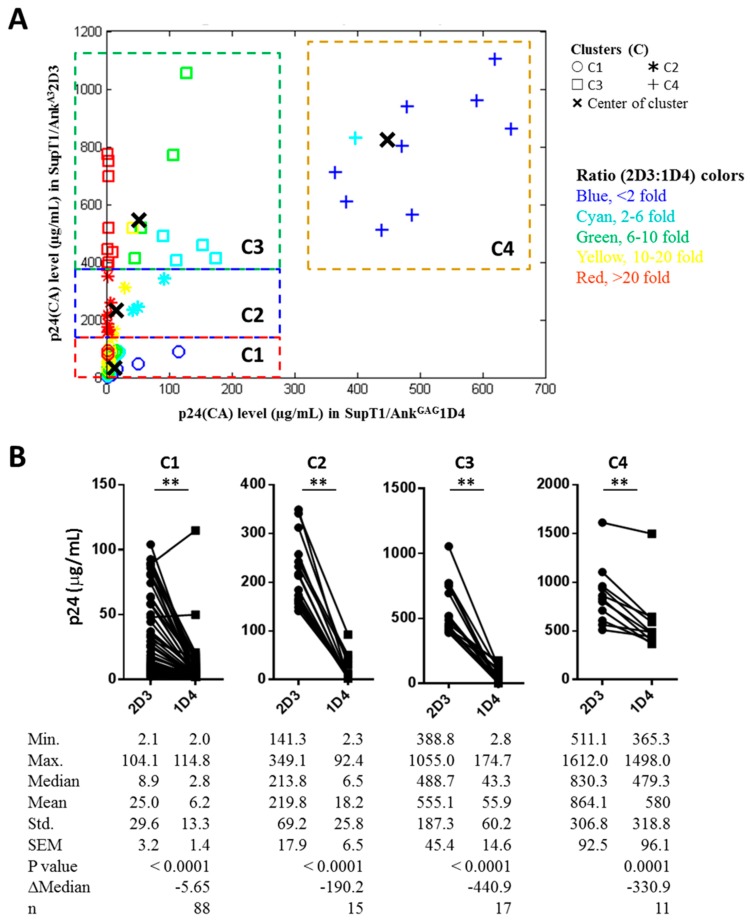
Figure 3.
Quantitative analysis of the p24CA levels of the four clusters. (A) Four clusters, namely C1, C2, C3, and C4, were classified by the K-means clustering method. In the case of C4, a dataset in which the p24CA levels of SupT1/AnkGAG1D4 and SupT1/AnkA32D3 were over 1500 µg/mL was excluded from the plot. (B) The p24CA level of the four clusters after being classified by the K-means clustering method. Significant differences (** p < 0.01) in the p24CA levels between SupT1/AnkGAG1D4 and SupT1/AnkA32D3 were determined using the two-tailed Wilcoxon matched-pairs signed-rank test.

