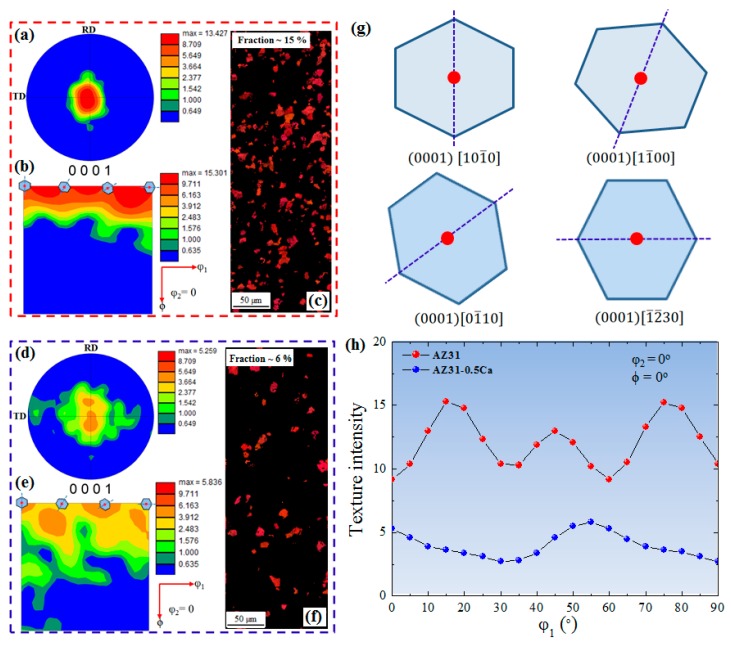
Figure 3.
(a,d) Pole figures; (b,e) orientation distribution function; and (c,f) ND inverse pole figure maps of partitioned basal grains of the AZ31 and AZ31-0.5Ca alloys, respectively; (g) The main orientations of the basal texture; (h) Orientation distribution function intensity of the two alloys along φ1 (φ2 = 0°, Φ = 0°).

