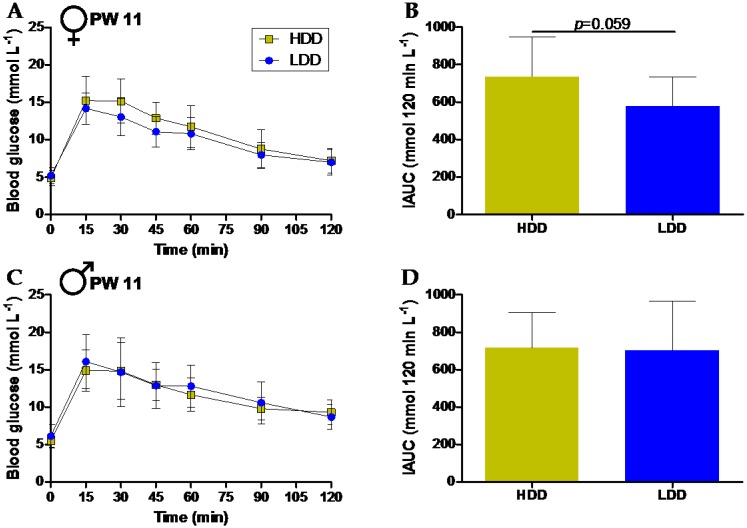
Figure 3.
Glucose tolerance after five weeks of HFD feeding (PW 11). Plasma glucose concentrations measured directly before (0 min) and after oral administration of a glucose bolus (2 g kg−1 BW) in female (A, n = 12 for HDD and n = 11 for LDD) and male (C, n = 11 for HDD and n = 12 for LDD) mice. Incremental area under the curve (iAUC) for blood glucose over the 120min period for females (B) and males (D). Data shown as mean ± s.d.

