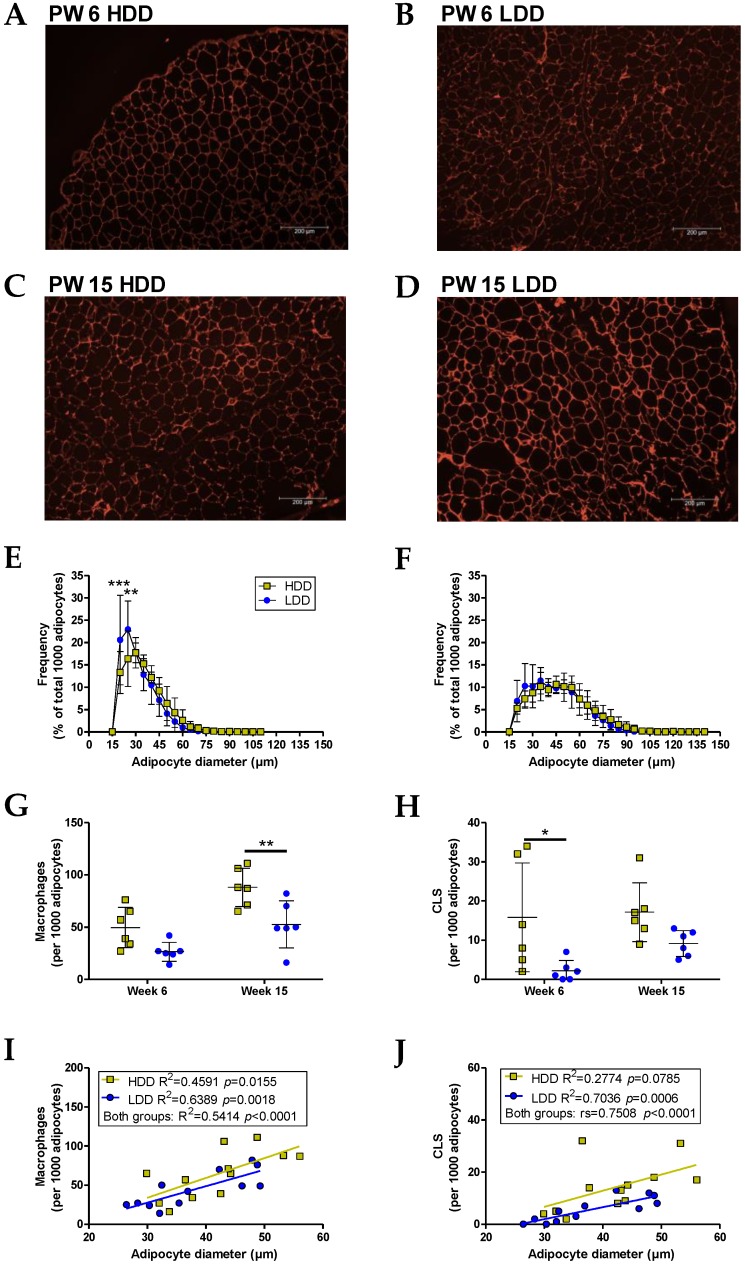
Figure 5.
Adipose tissue histology, adipocyte size distribution, and macrophage infiltration markers in the gWAT of females at the end of the post-weaning intervention (PW 6) and after the HFD feeding period (PW 15). Representative histological pictures of gWAT using hematoxylin–eosin (HE) staining in HDD-fed (A) and LDD-fed mice (B) at the end of the post-weaning intervention (PW 6), and HDD-fed (C) and LDD-fed mice (D) after the HFD feeding period (PW 15). Photos were made using fluorescent microscopy. Distribution of adipocyte diameter (5 µm bins) in gWAT pads collected in PW 6 (E) and PW 15 (F). Total count of macrophages (G) and crown-like structures (CLS, H) identified in the same areas using MAC-2 immunohistochemical staining. Correlation plots of adipocyte diameters with (I) macrophage and (J) CLS counts for all of the animals in each group. All of the coefficients were obtained with Pearson correlation except for the CLS of the combined HDD and LDD groups (rs = Spearman correlation coefficient). n = 12 per dietary group, n = six per age (PW 6 or PW 15). Data shown as mean ± s.d. Statistical differences denoted as ** p ≤ 0.01 and *** p ≤ 0.001.

