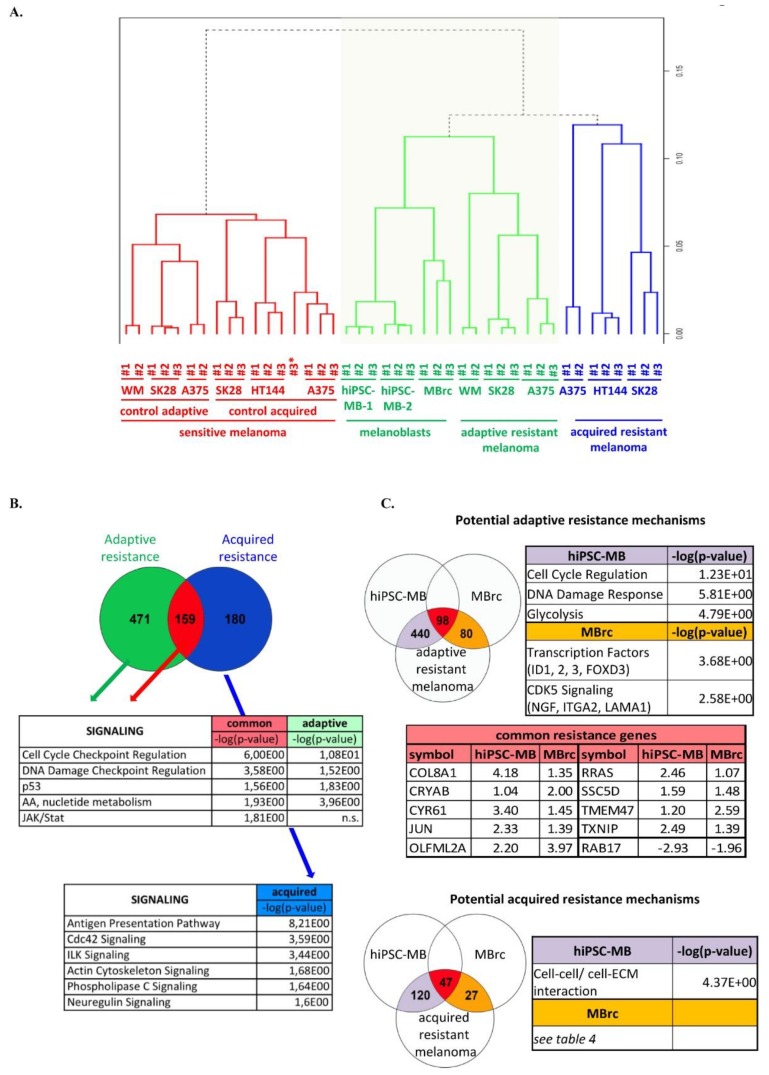
Figure 2.
The transcriptome of melanoblasts is closer to that of adaptive resistant melanoma than to that of acquired resistant melanoma. (A) Dendrogram representing hierarchical clustering of the transcriptome of the two melanoblast populations (green label) and of adaptive (green label), acquired resistant (blue label), and sensitive (red label) metastatic melanoma cell lines. Note: A375#3* belongs to the control adaptive sensitive melanoma sample. The function hcluster was used, in which the parameter correlation evokes the computation of Pearson-type distances. “WM” melanoma cell line stands for “WM266-4”. (B) Venn diagram representing the regulated genes in either adaptive resistant melanoma samples and melanoblasts samples (green circle) or acquired resistant melanoma samples and melanoblasts (blue circle), compared to the respective sensitive melanoma samples. Gene set enrichment analysis was performed for the two gene lists with Ingenuity software (IPA). The results are presented in the tables. (C) Potential resistance mechanisms were investigated in both melanoblast populations in the adaptive resistance situation (top panel) or in the acquired resistance situation (bottom panel). Color code: red diagrams represent genes regulated in all groups in both adaptive and acquired situations, violet diagrams represent resistance genes regulated in hiPSC-MB only, and orange diagrams represent resistance genes regulated in MBrc only.

