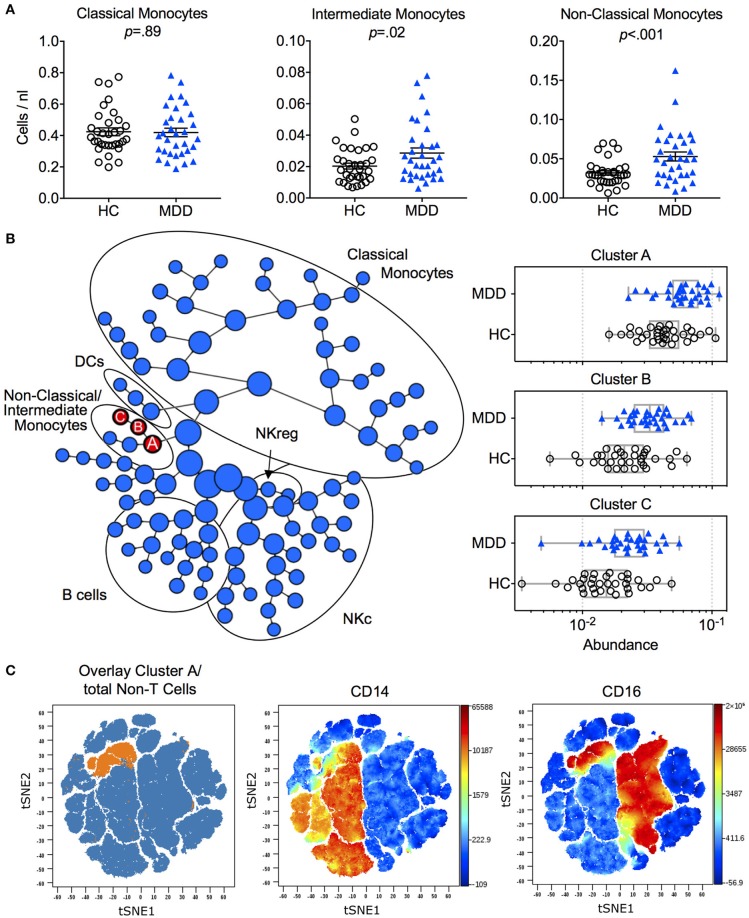
Figure 1.
Immune phenotype in MDD patients and matched healthy controls. (A) Absolute cell counts of monocyte subtypes (mean ± S.E.M) in MDD patients compared to matched healthy controls. Gating strategy for identification of classical (CD14++/CD16−), intermediate (CD14++/CD16+) and non-classical (CD14+/CD16++) monocytes is depicted in Figure S1. (B) Results of manual gating were confirmed by means of an automated clustering algorithm (CITRUS) which identified group differences in the abundance of clusters A, B and C corresponding to monocytes expressing CD16. (C) In order to visualize these stratifying subsets on single cell viSNE maps, FCS files of cluster A (containing all events from clusters B and C) were exported per subject, concatenated and projected on the total input population (= Non-T cells). HC, Healthy Controls; MDD, Major Depressive Disorder; DCs, Dendritic Cells, NKc, cytotoxic NK cells, NKreg, regulatory NK cells.

