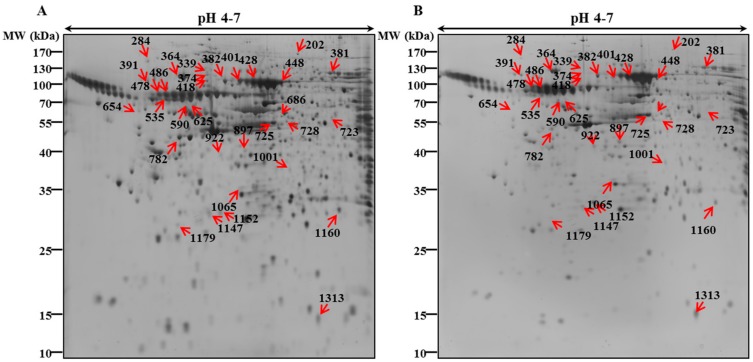
Figure 2.
Representative Two-dimensional gel electrophoresis proteome maps of the control and pectolinarigenin-treated AGS cells. The (A) control and (B) PEC-treated (100 μM) of AGS cells, the cells were incubated with 100 µM of PEC for 24 h. The total proteins were separated on 18 cm linear IPG strips (pH 4–7) in the first dimension and in the second dimension with 12% second dimension sodium dodecyl sulfate-polyacrylamide gel electrophoresis (SDS-PAGE). The gels were silver stained. The numbered arrows indicate protein spots successfully identified by matrix-assisted laser desorption/ionization time-of-flight/time-of-flight tandem mass spectrometry. The experiments were performed in triplicate.

