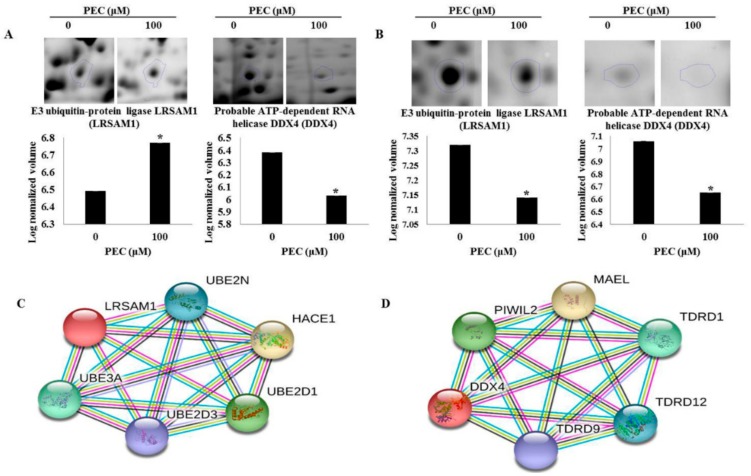
Figure 5.
Megascopic pictures and relative volume intensity of differential expressed proteins spots identified in pectolinarigenin-treated (A) AGS and (B) MKN28 cells. Gels were scanned and image analysis was performed using Progenesis Samespots software. The spots differing significantly in their intensities (fold-change ≥ 1.5) in pectolinarigenin-treated AGS and MKN28 cells, correlated with untreated control cells. The protein (C) LRSAM1 and (D) DDX4 are interacted with other proteins in STRING database (high confidence level: 0.700, developed five signaling modules). The data are shown as the mean ± standard deviation of three independent experiments (* p < 0.05 vs. control).

