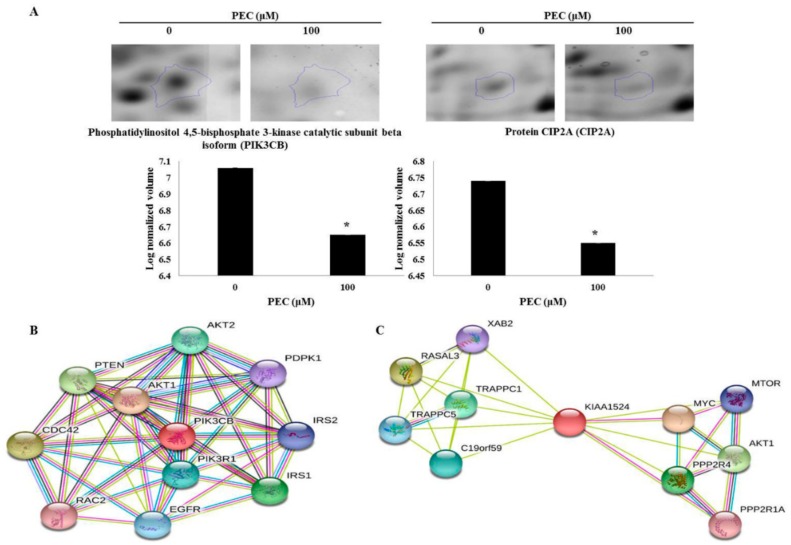
Figure 6.
Expression profiles of magnified two-dimensional gel electrophoresis spots identified in pectolinarigenin-treated MKN28 cells. (A) The spots of PIK3CB and CIP2A are differentially expressed in MKN28 cells. Gels were scanned and image analysis was performed using Progenesis Samespots software. The spots differing significantly in their intensities (fold-change ≥ 1.5) in pectolinarigenin-treated AGS and MKN28 cells, as compared with untreated control cells. (B) PIK3CB and (C) CIP2A are related with PI3K/AKT/mTOR pathway in STRING database (high confidence level: 0.700 developed 10 signaling modules). The data are shown as the mean ± standard deviation of three independent experiments (* p < 0.05 vs. control).

